Cost Optimization
AWS
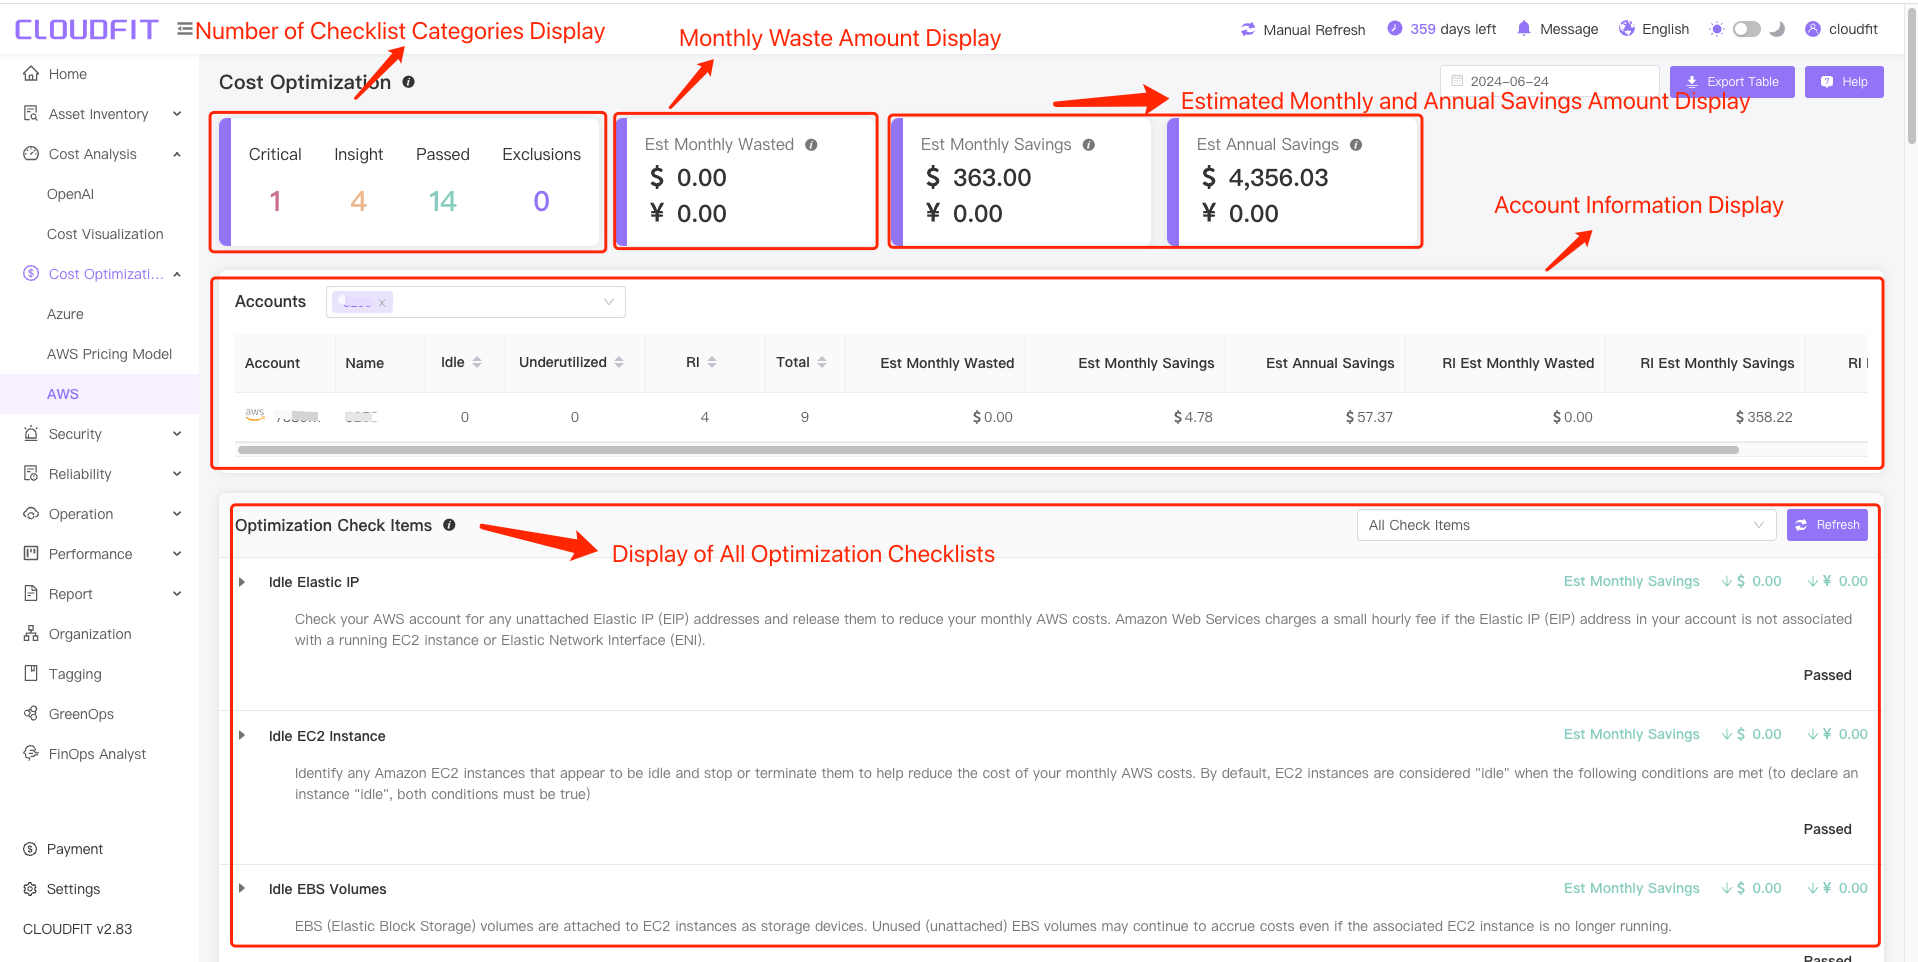
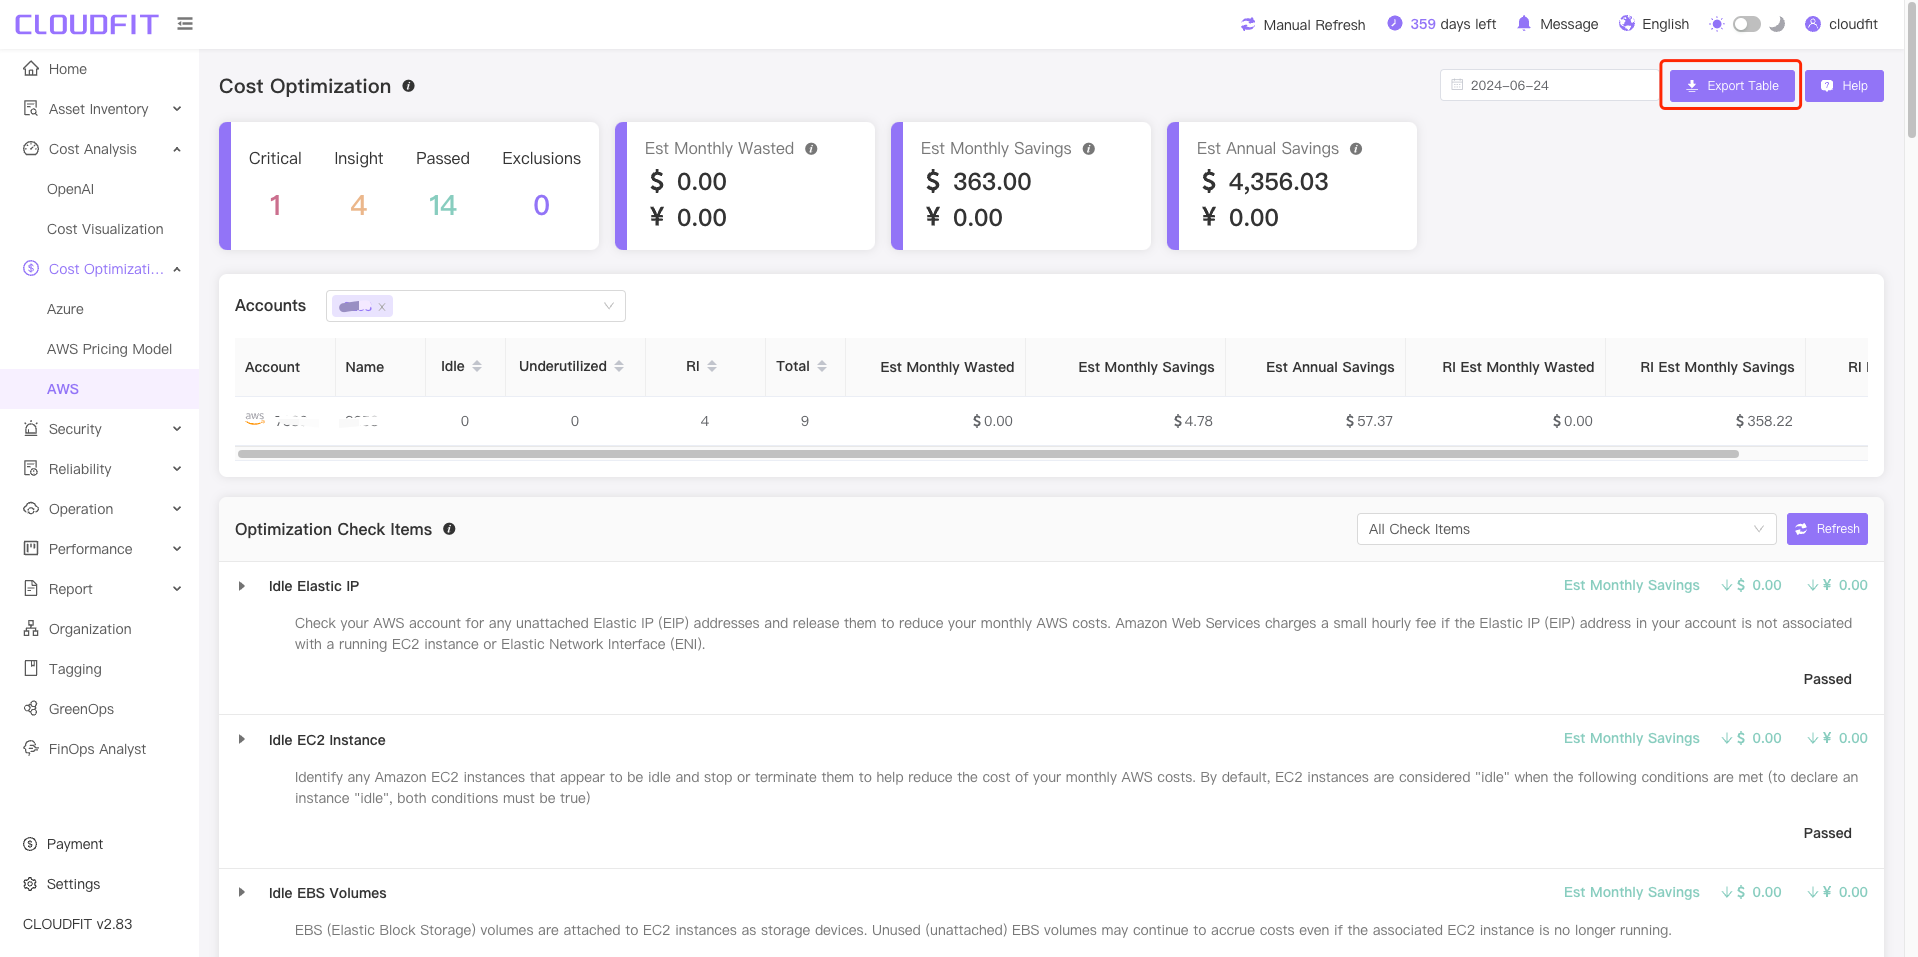
Click on Cost Optimization -> AWS in the navigation bar to enter the page, as shown below:
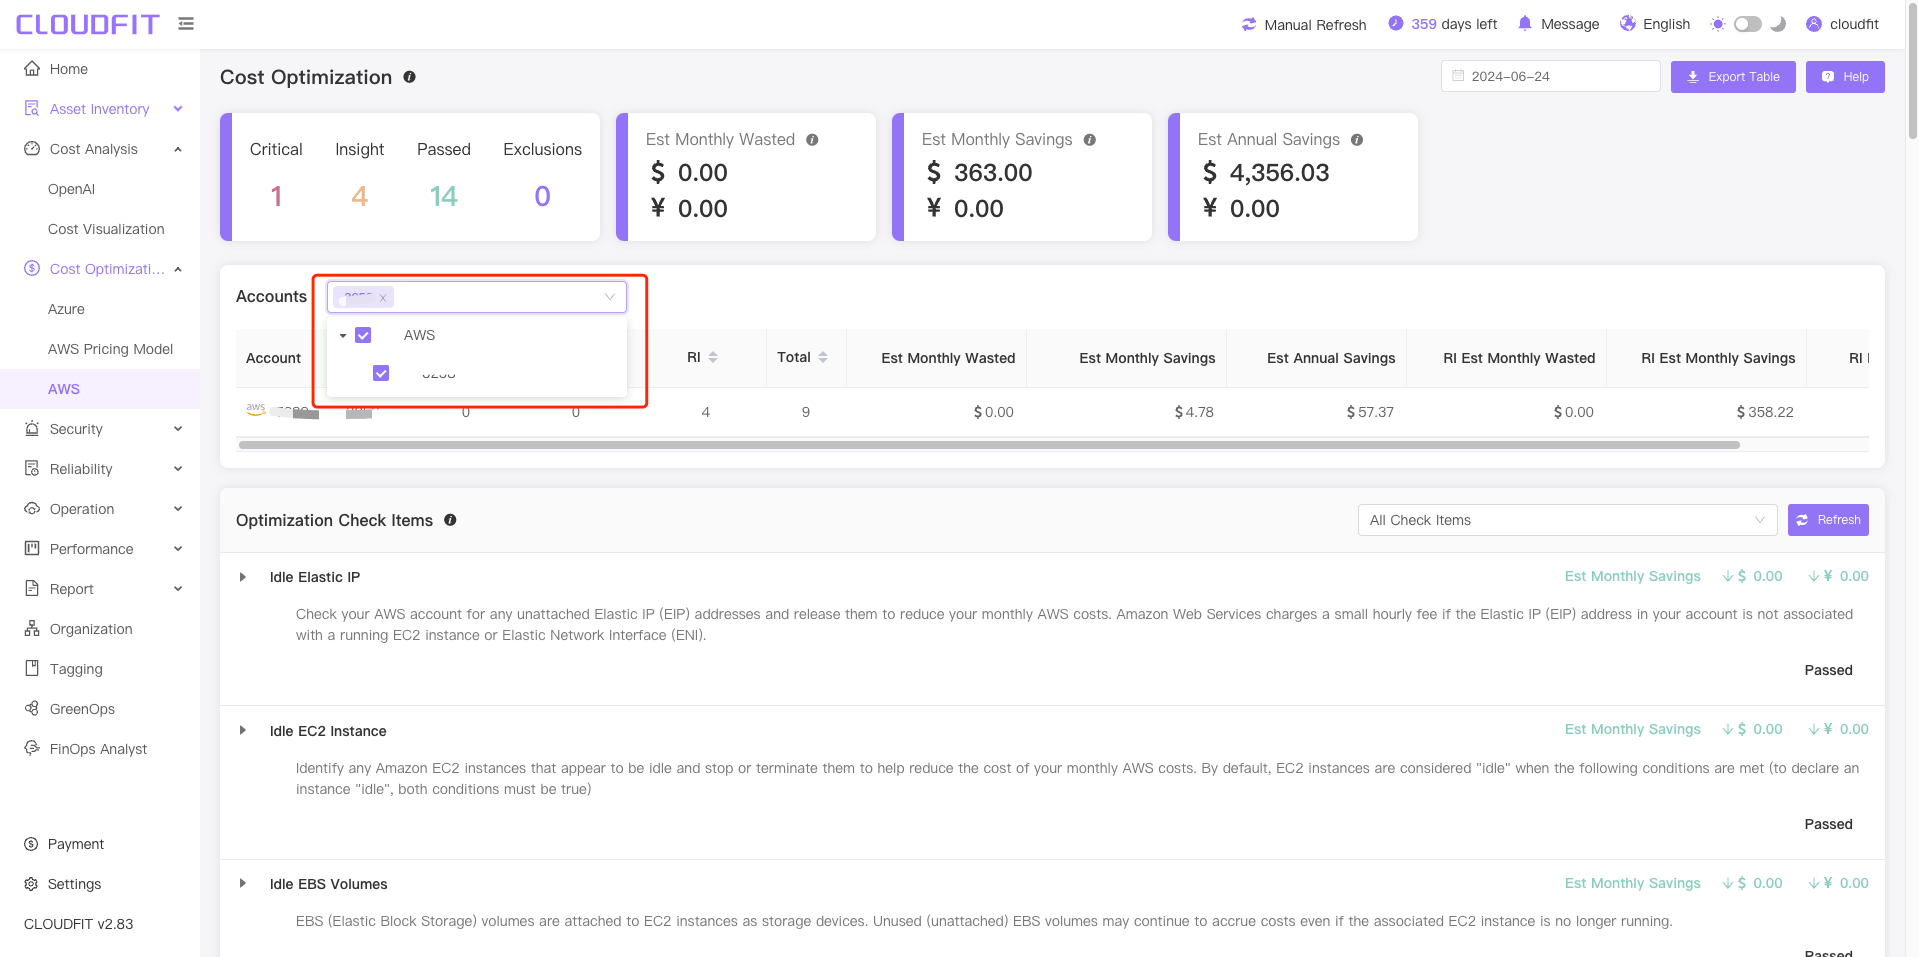
Account Filter
Click on the Account Filter Box to view the optimization costs for one or multiple accounts, as shown below:
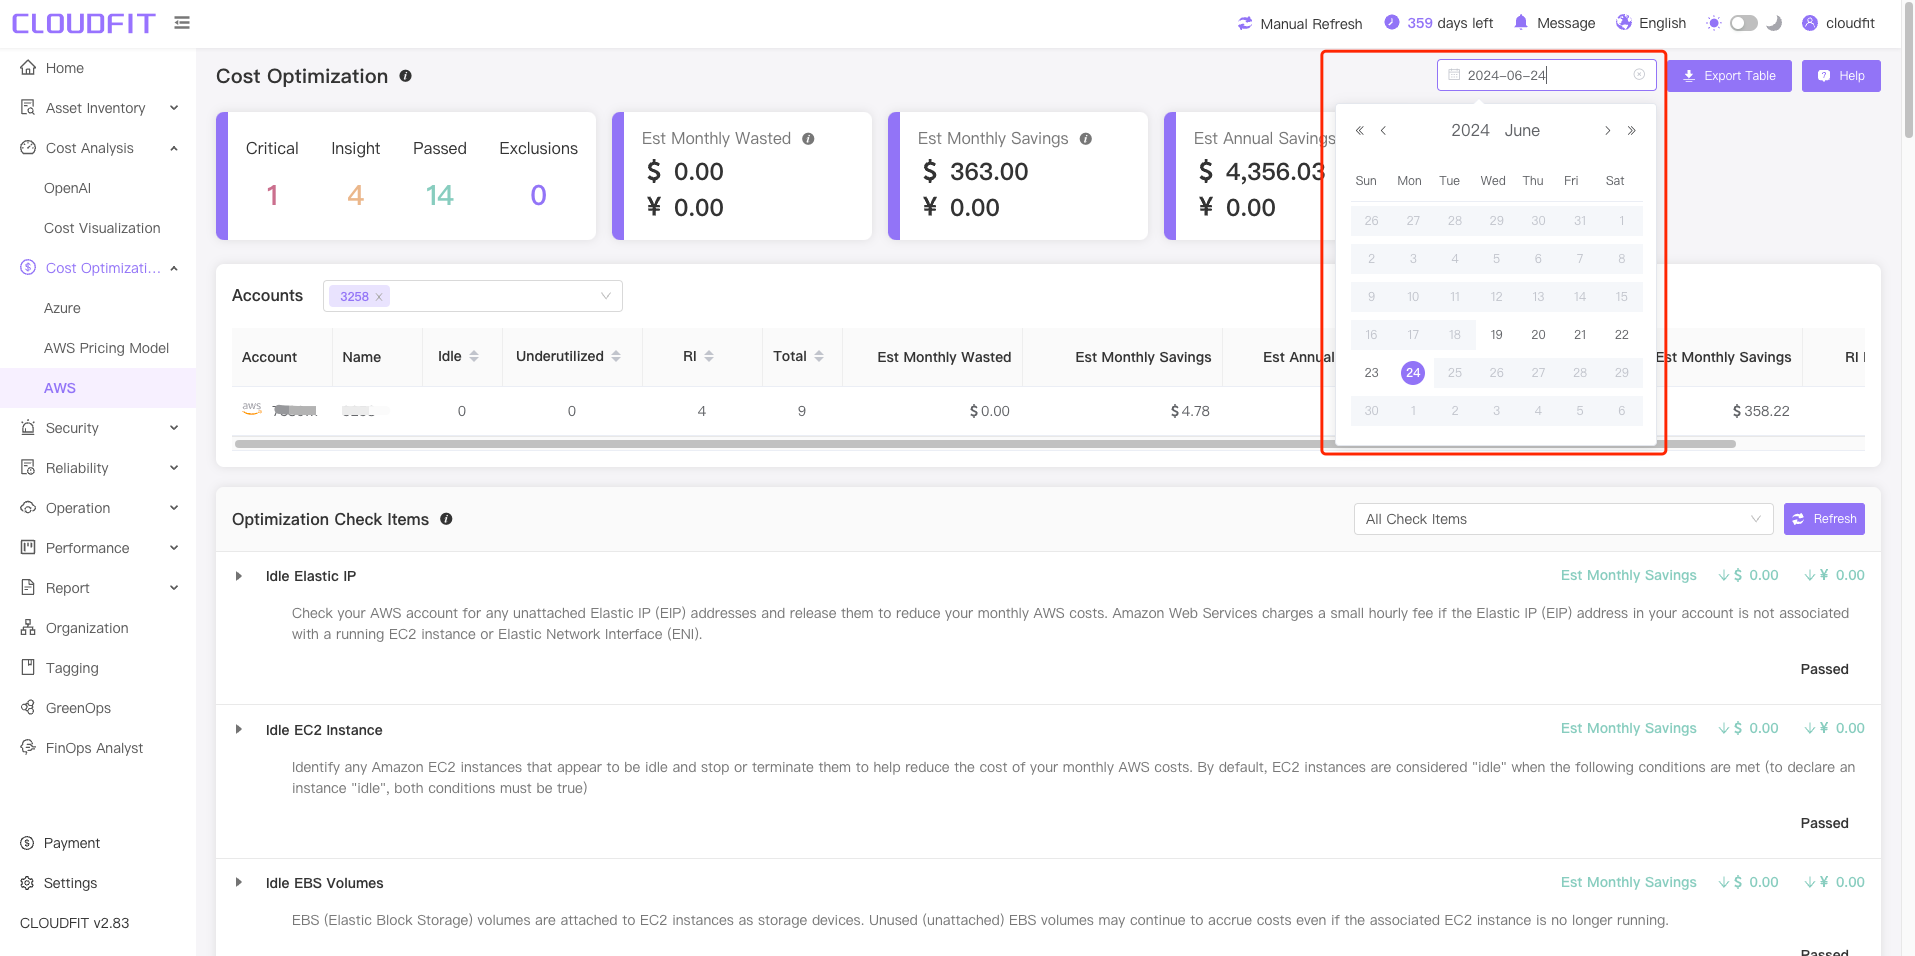
Date Filter
You can query the cost optimization status for any date, as shown below:
Export Optimization Check Items to Excel
Click the Export Table icon in the upper right corner to export all optimization check item data to Excel, as shown below:
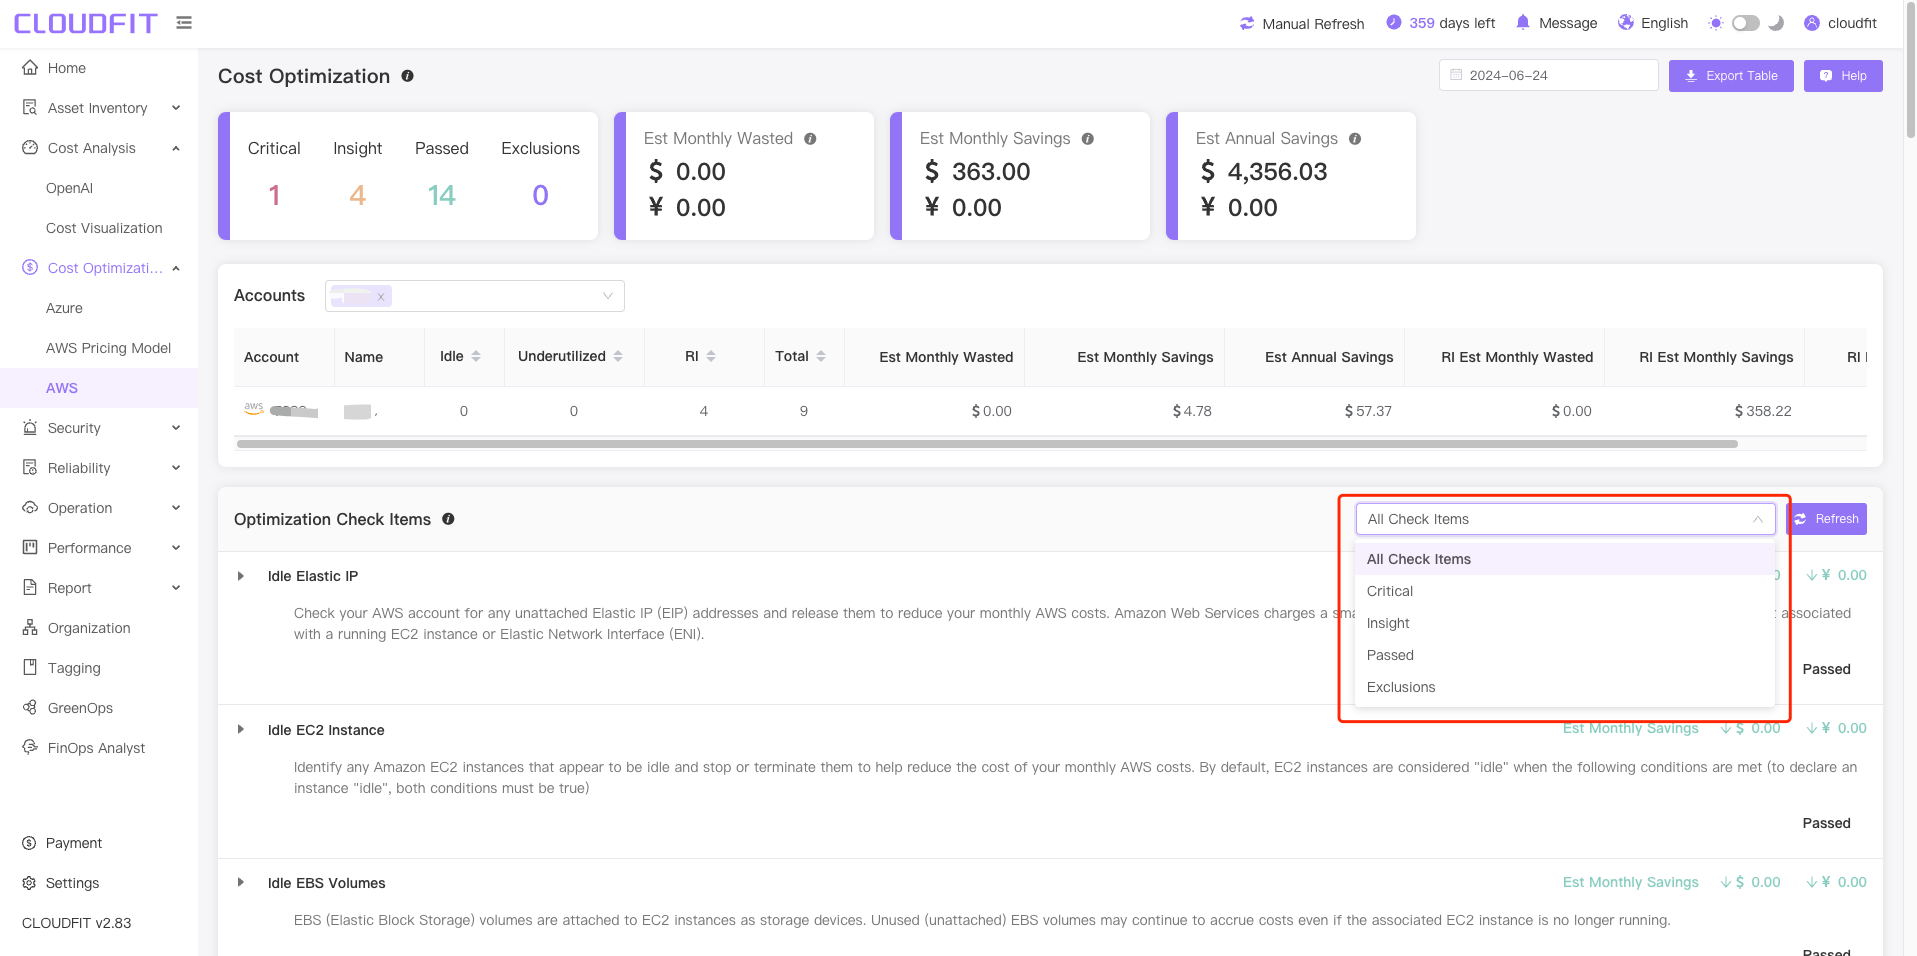
Check Item Filter
As shown below:
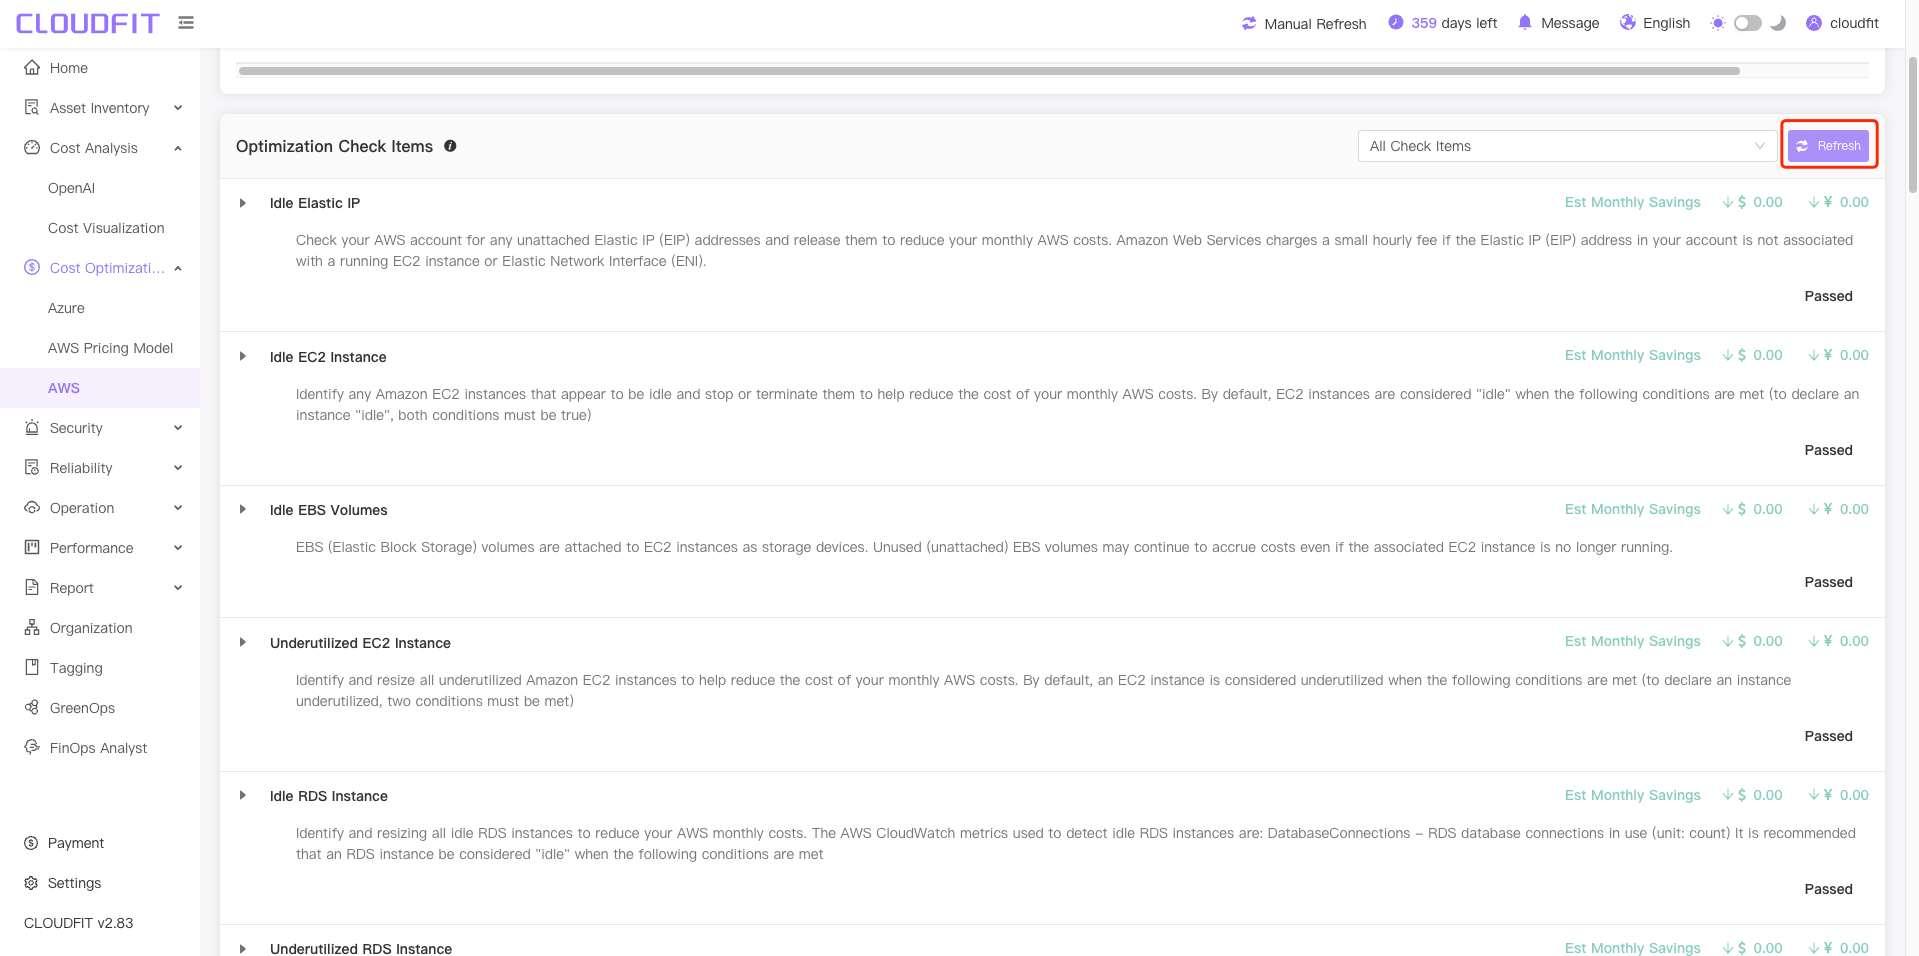
Refresh
As shown below:
AWS CLI
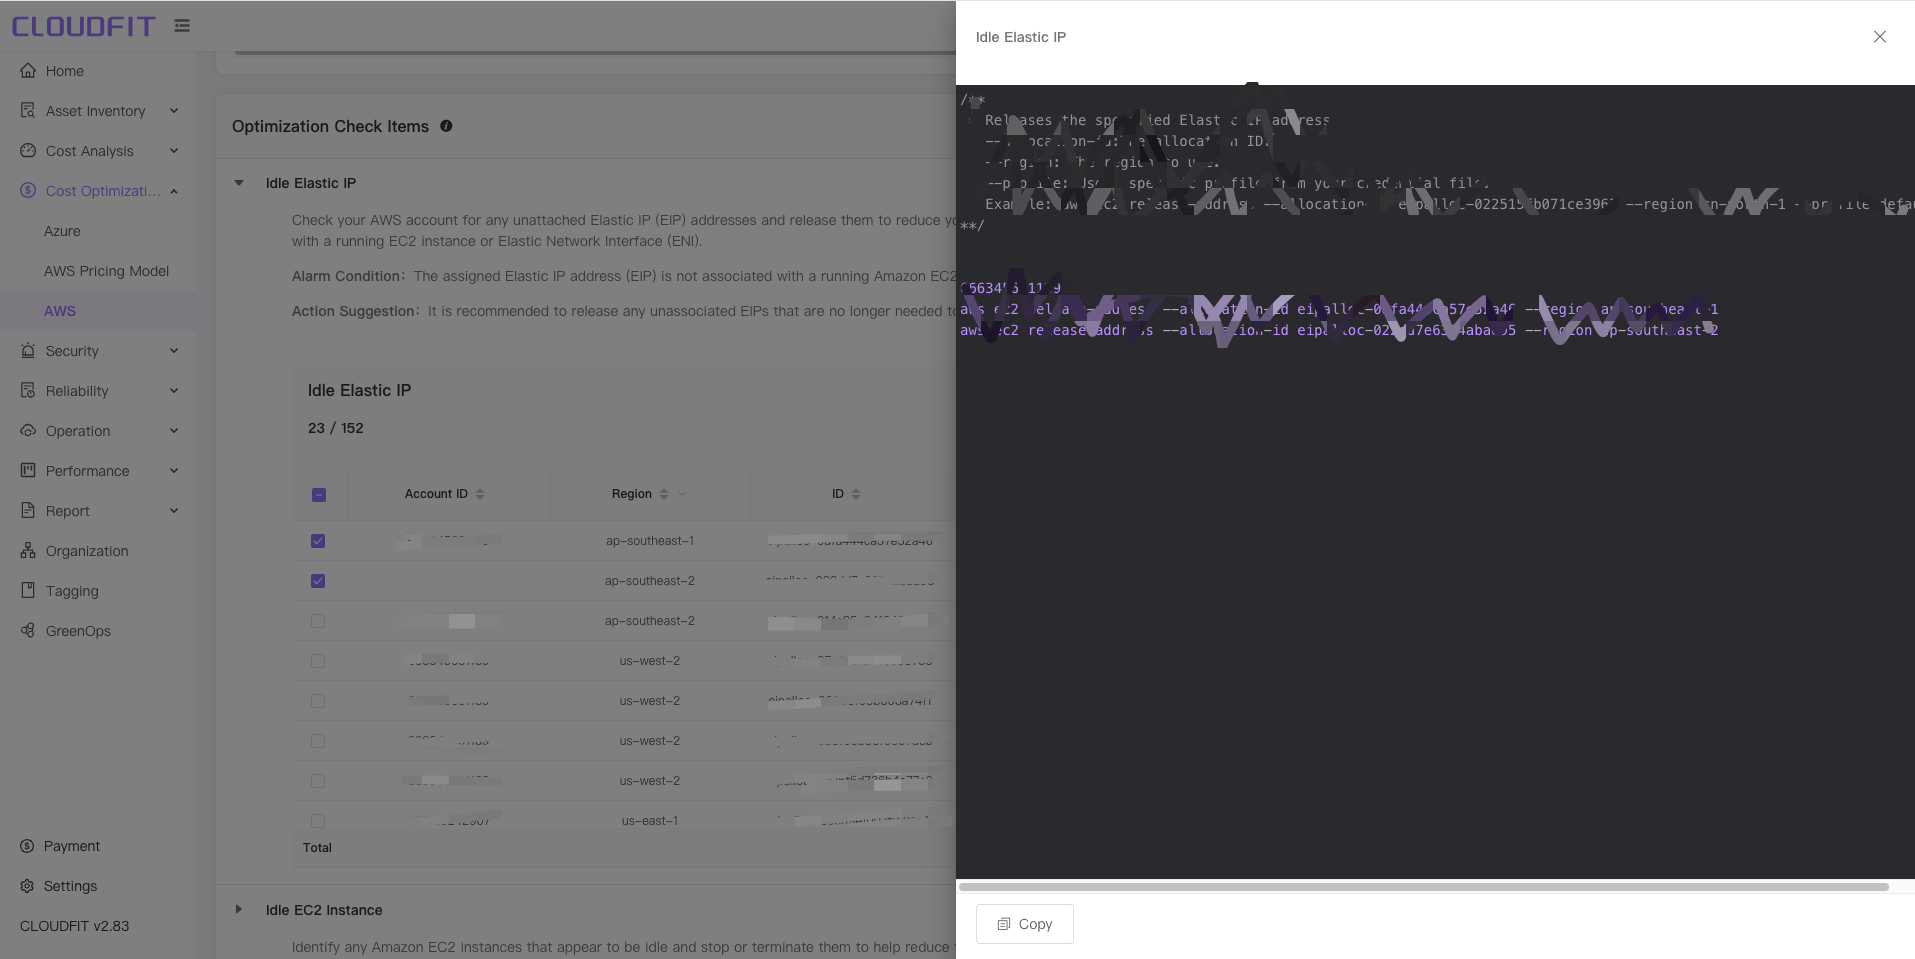
Expand the item to be checked -> Select the item -> Click the AWS CLI button, as shown below:
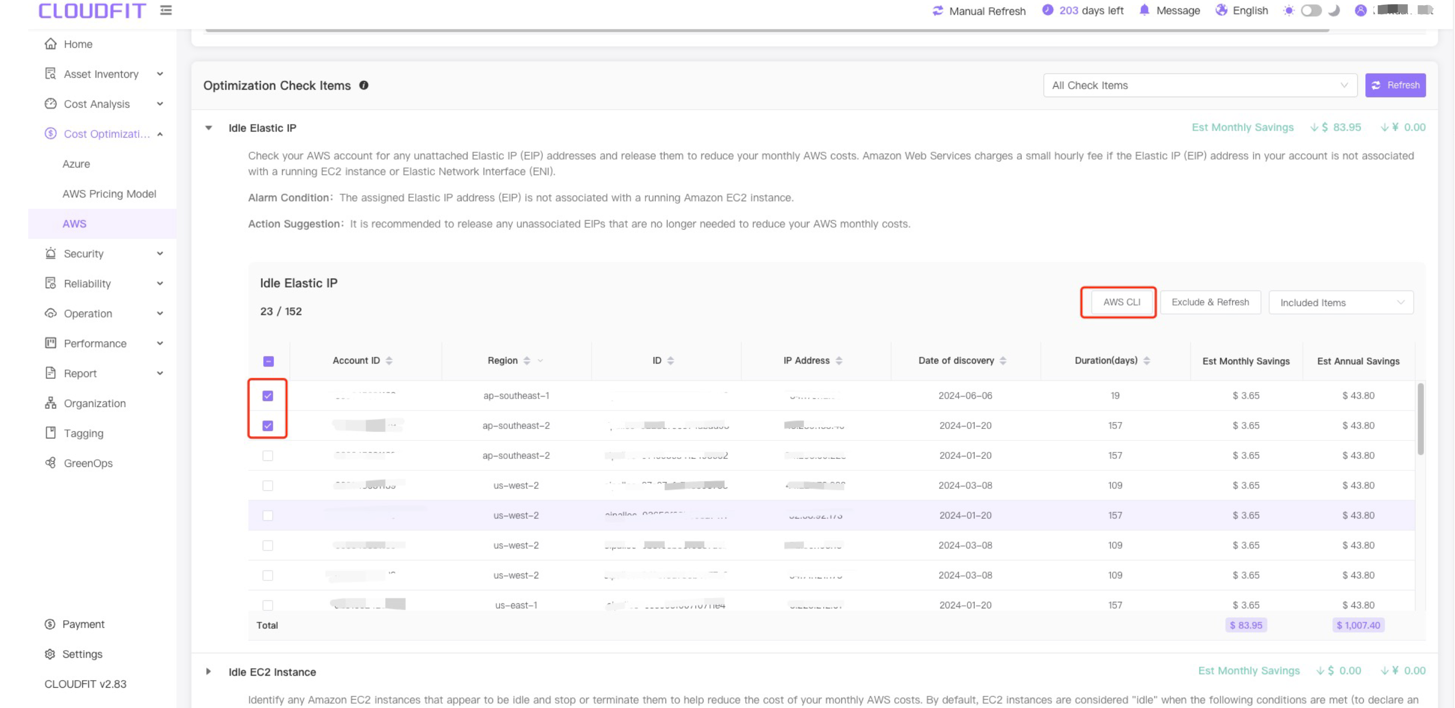
After clicking the AWS CLI button, as shown below:
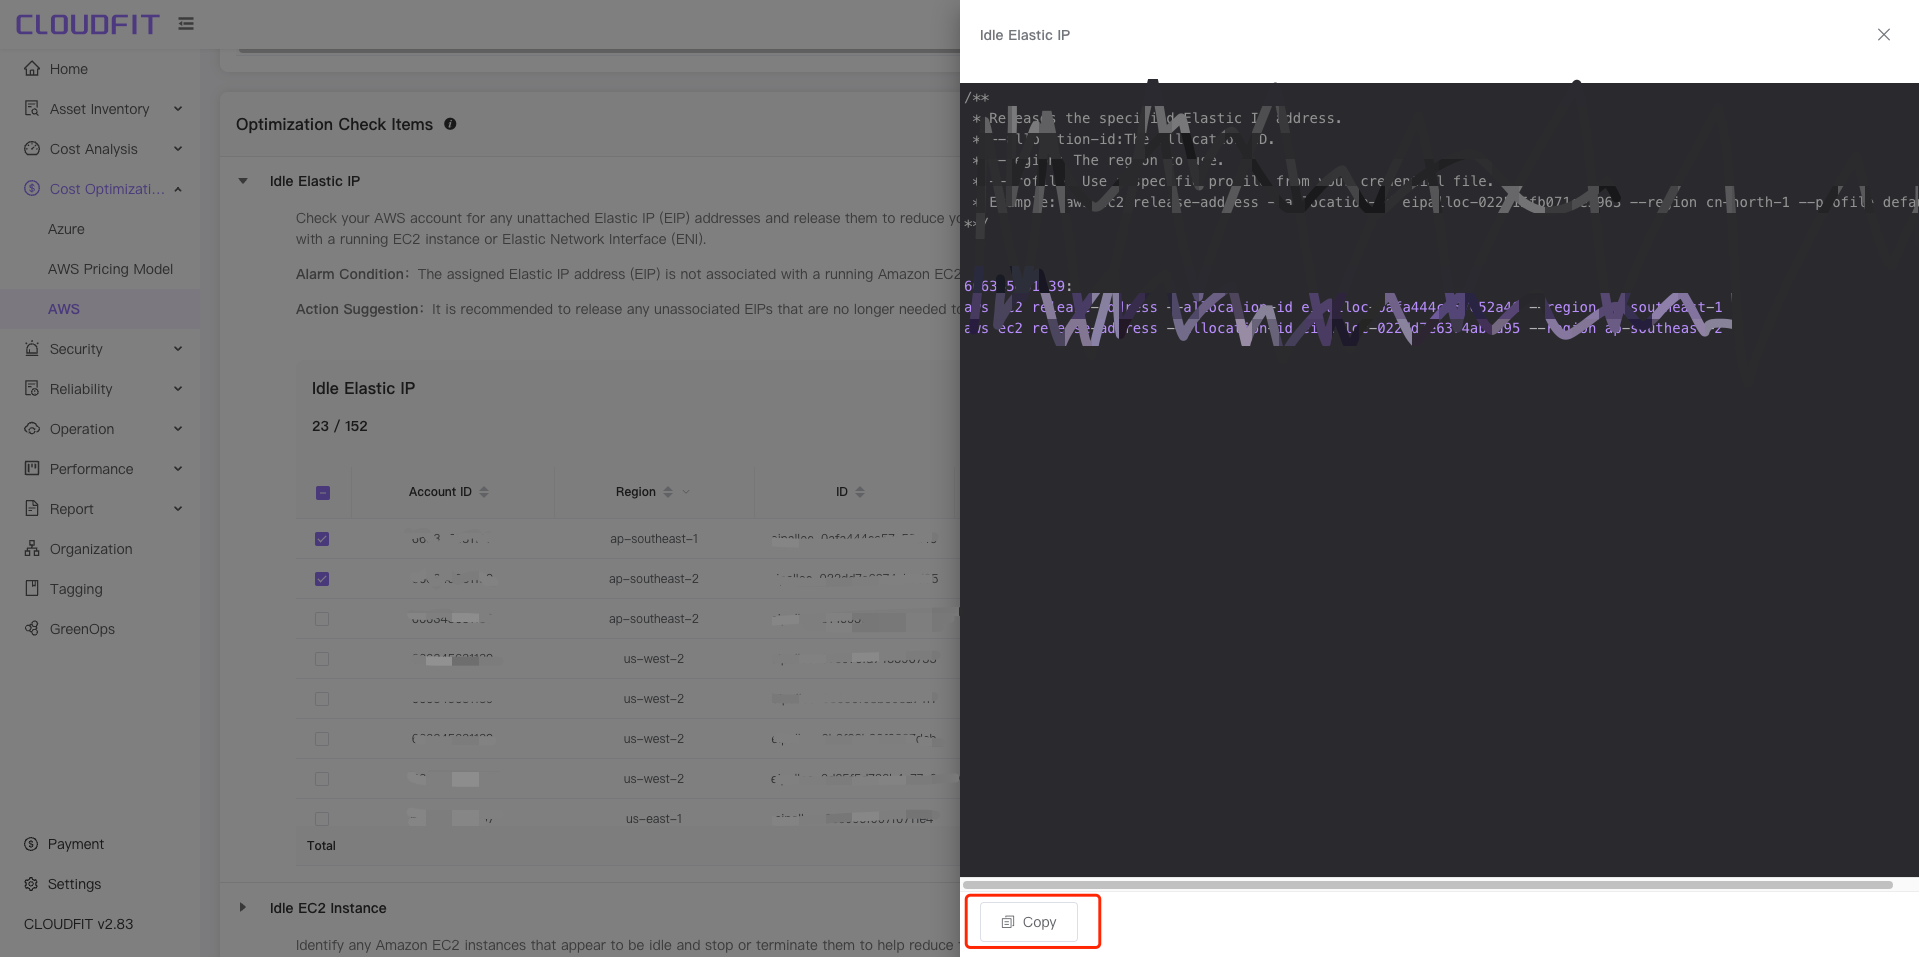
Copy
Click the Copy button below to copy the CLI, as shown below:
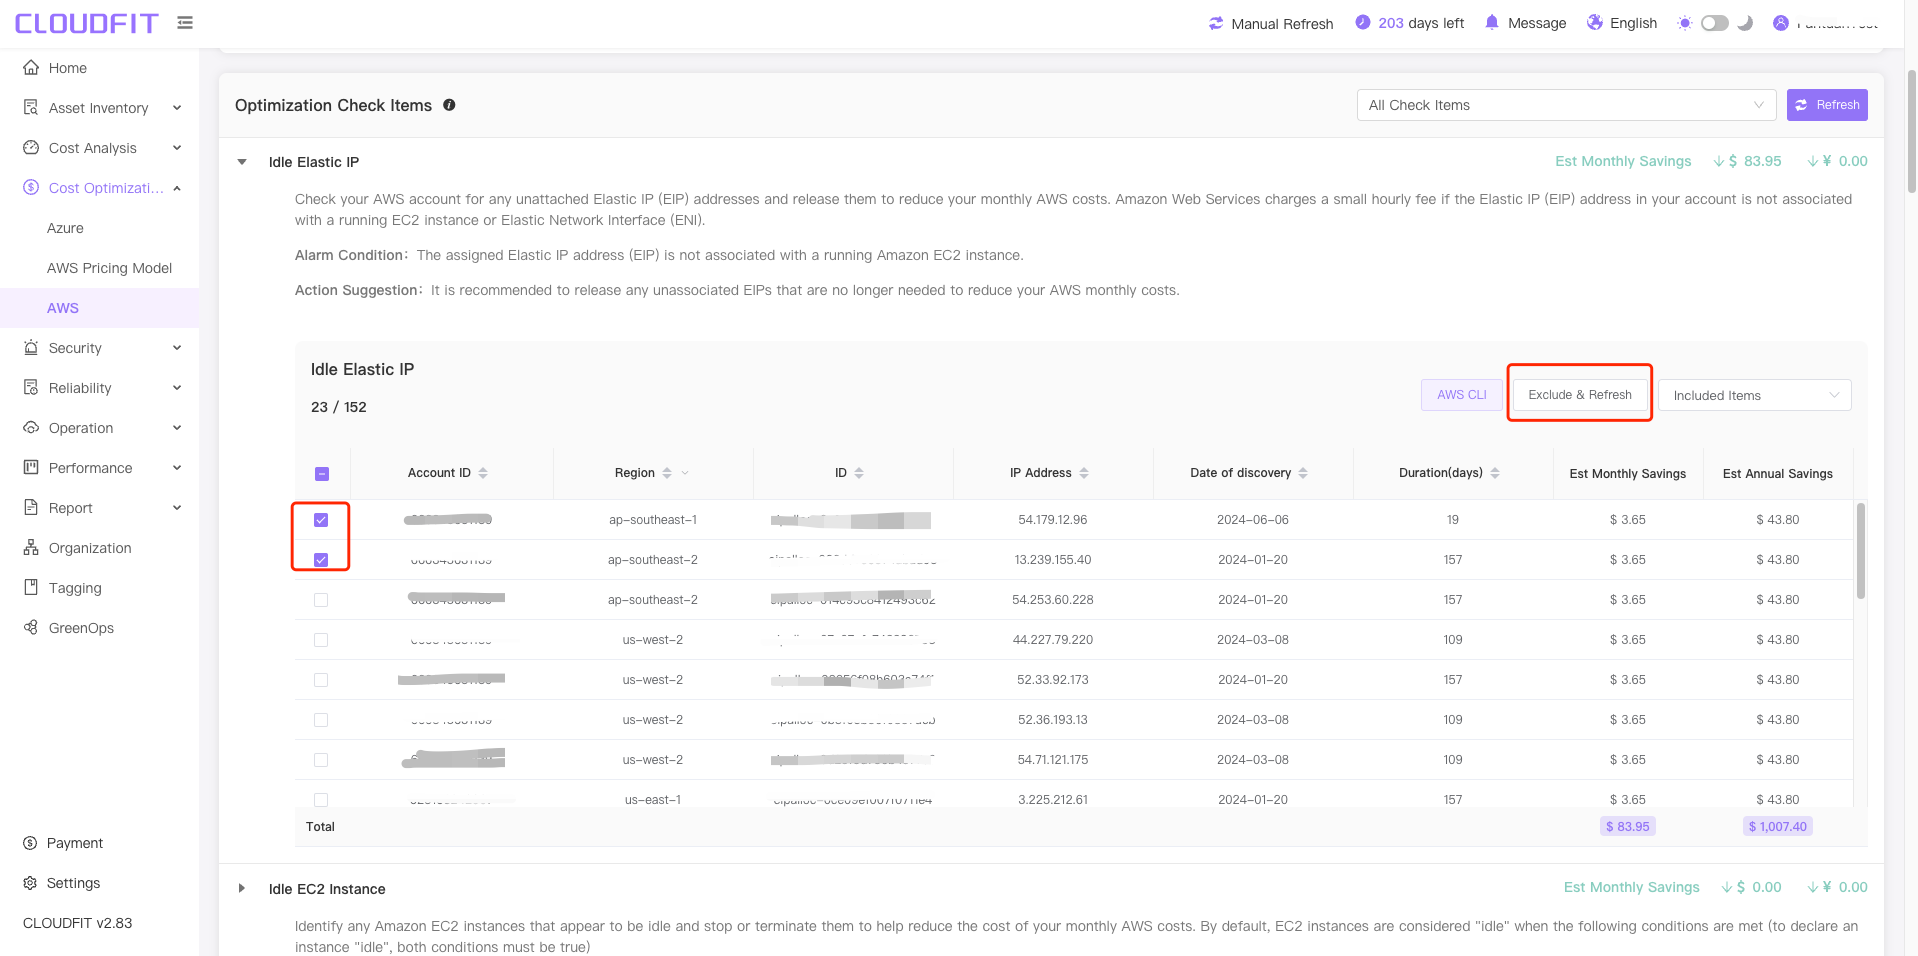
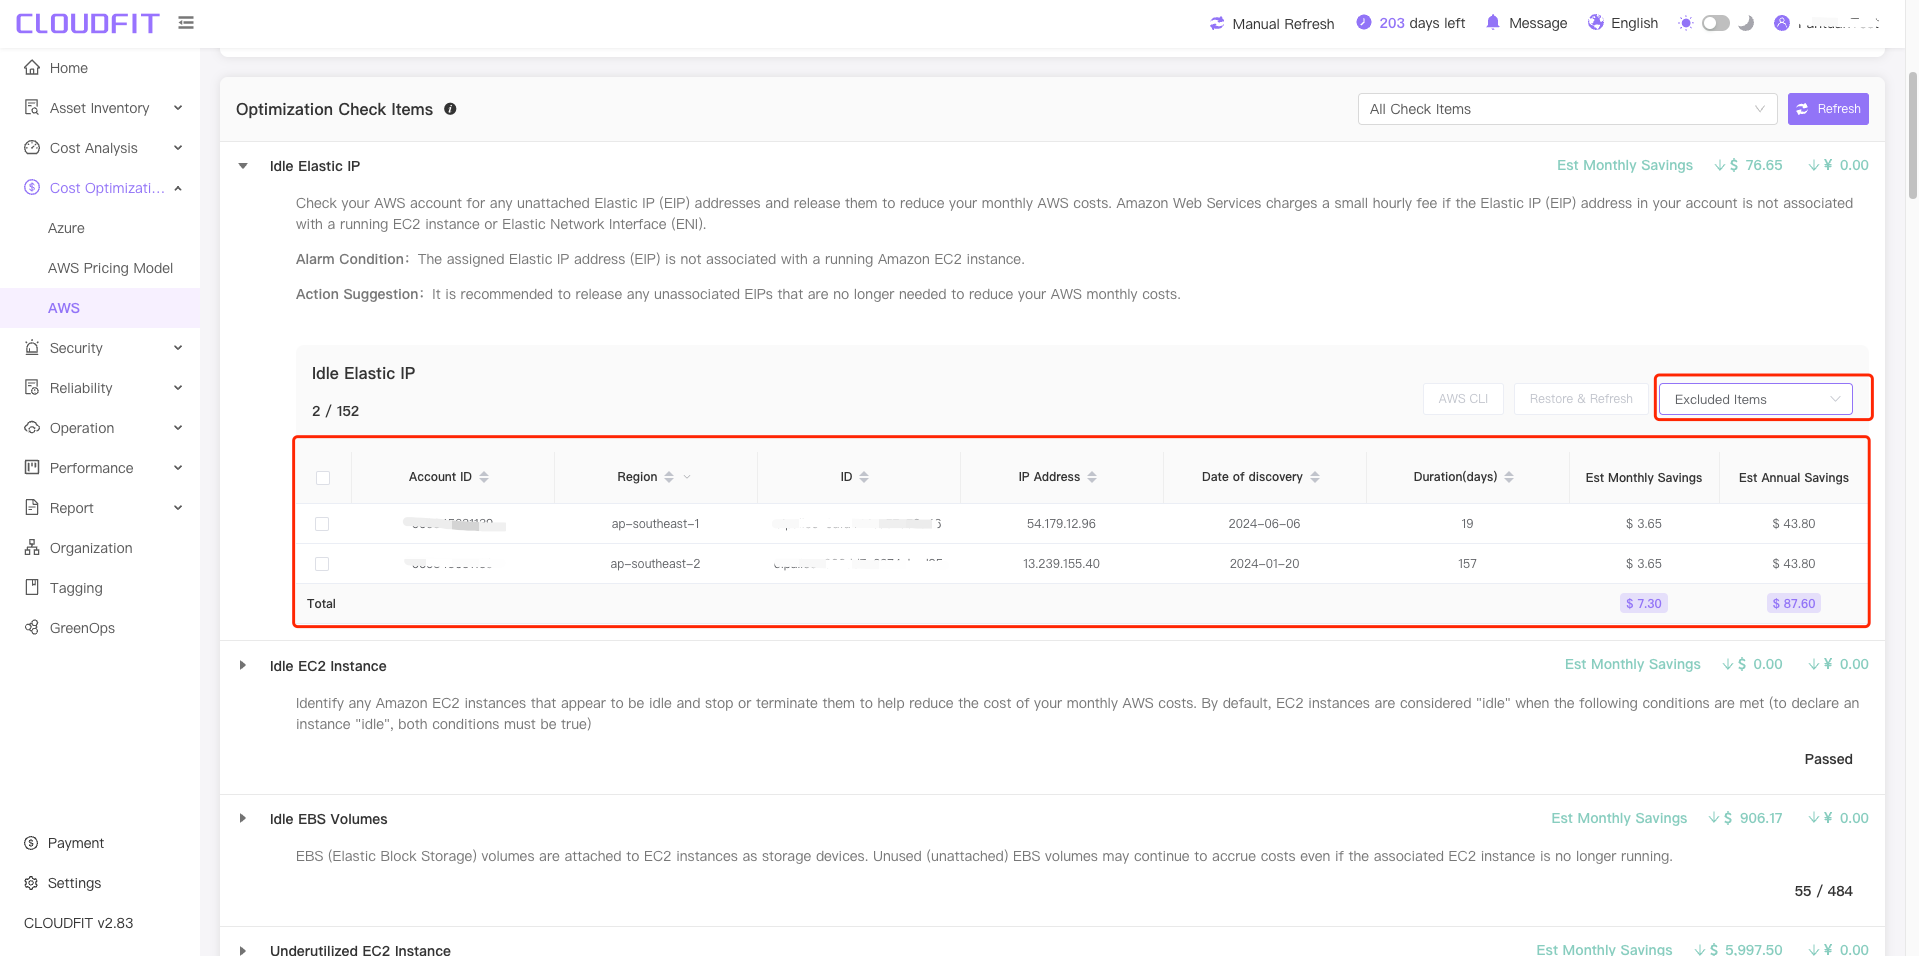
Exclude Items
Expand the item to be checked -> Select the item -> Click the Exclude & Refresh button, as shown below:
To view excluded items, click the Included Item sbutton -> Click the Excluded Items button, as shown below:
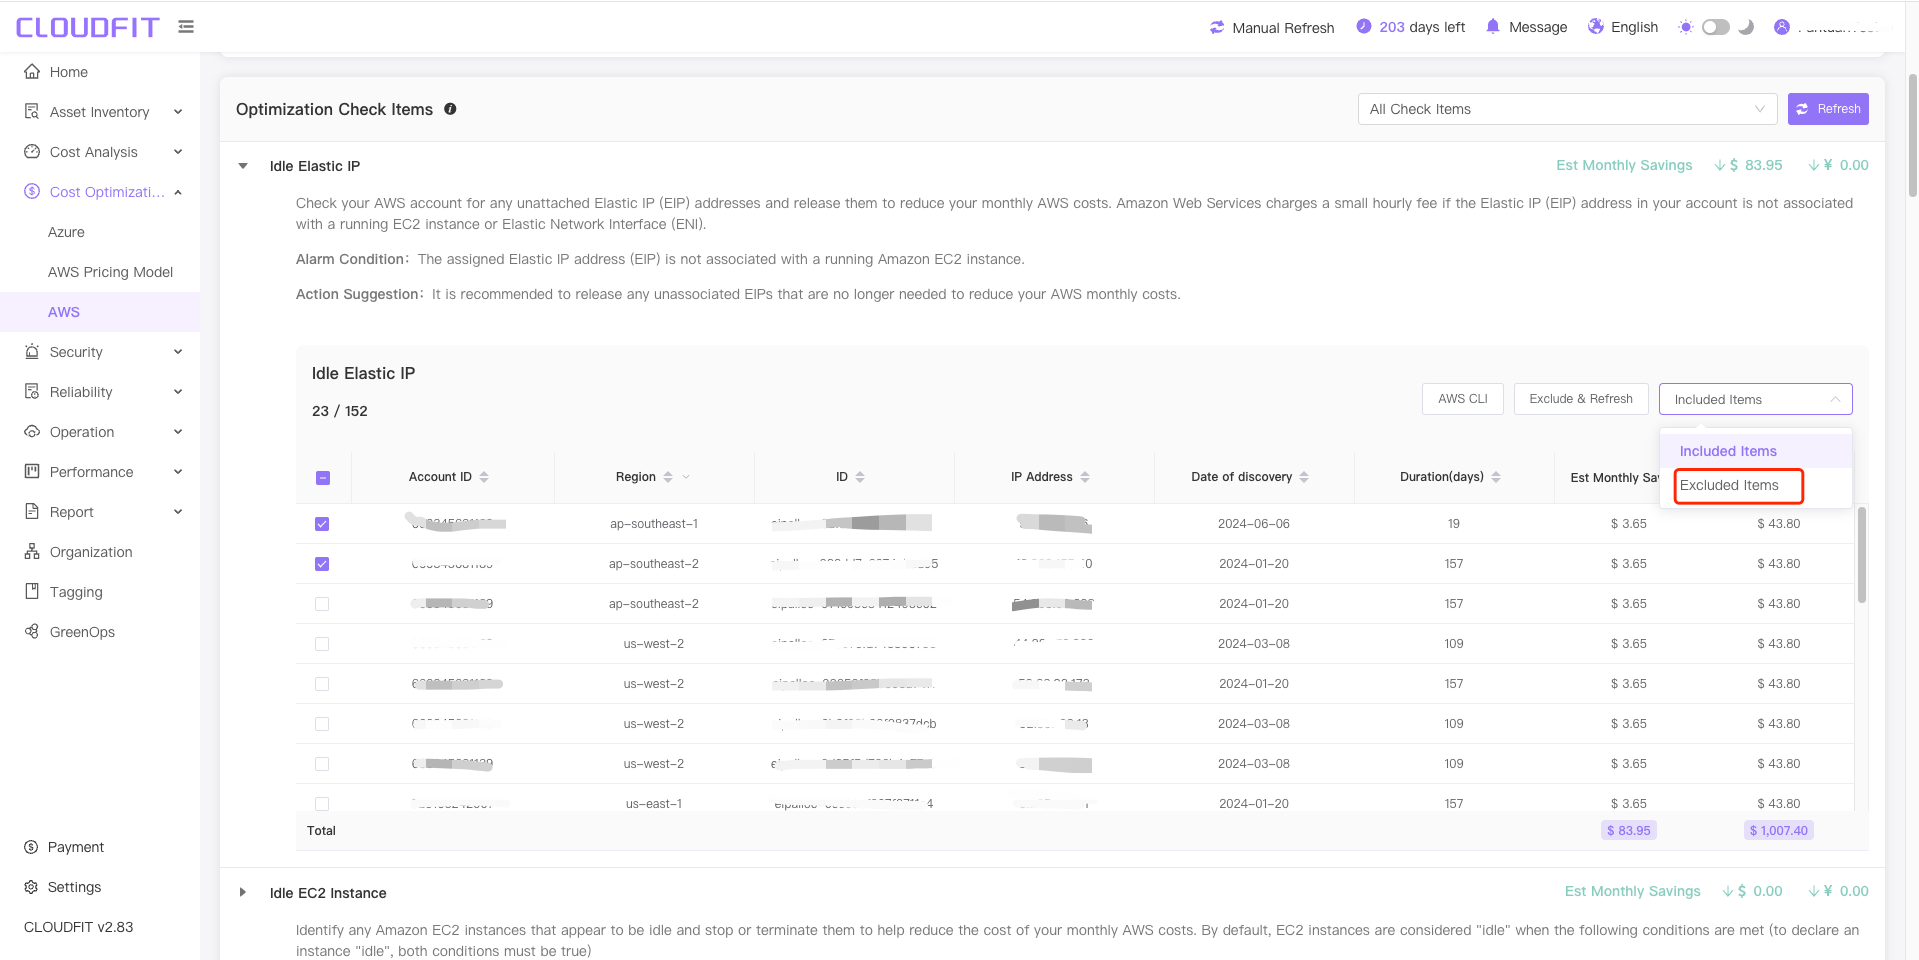
After clicking the Excluded Items button successfully, you can view the excluded items, as shown below:
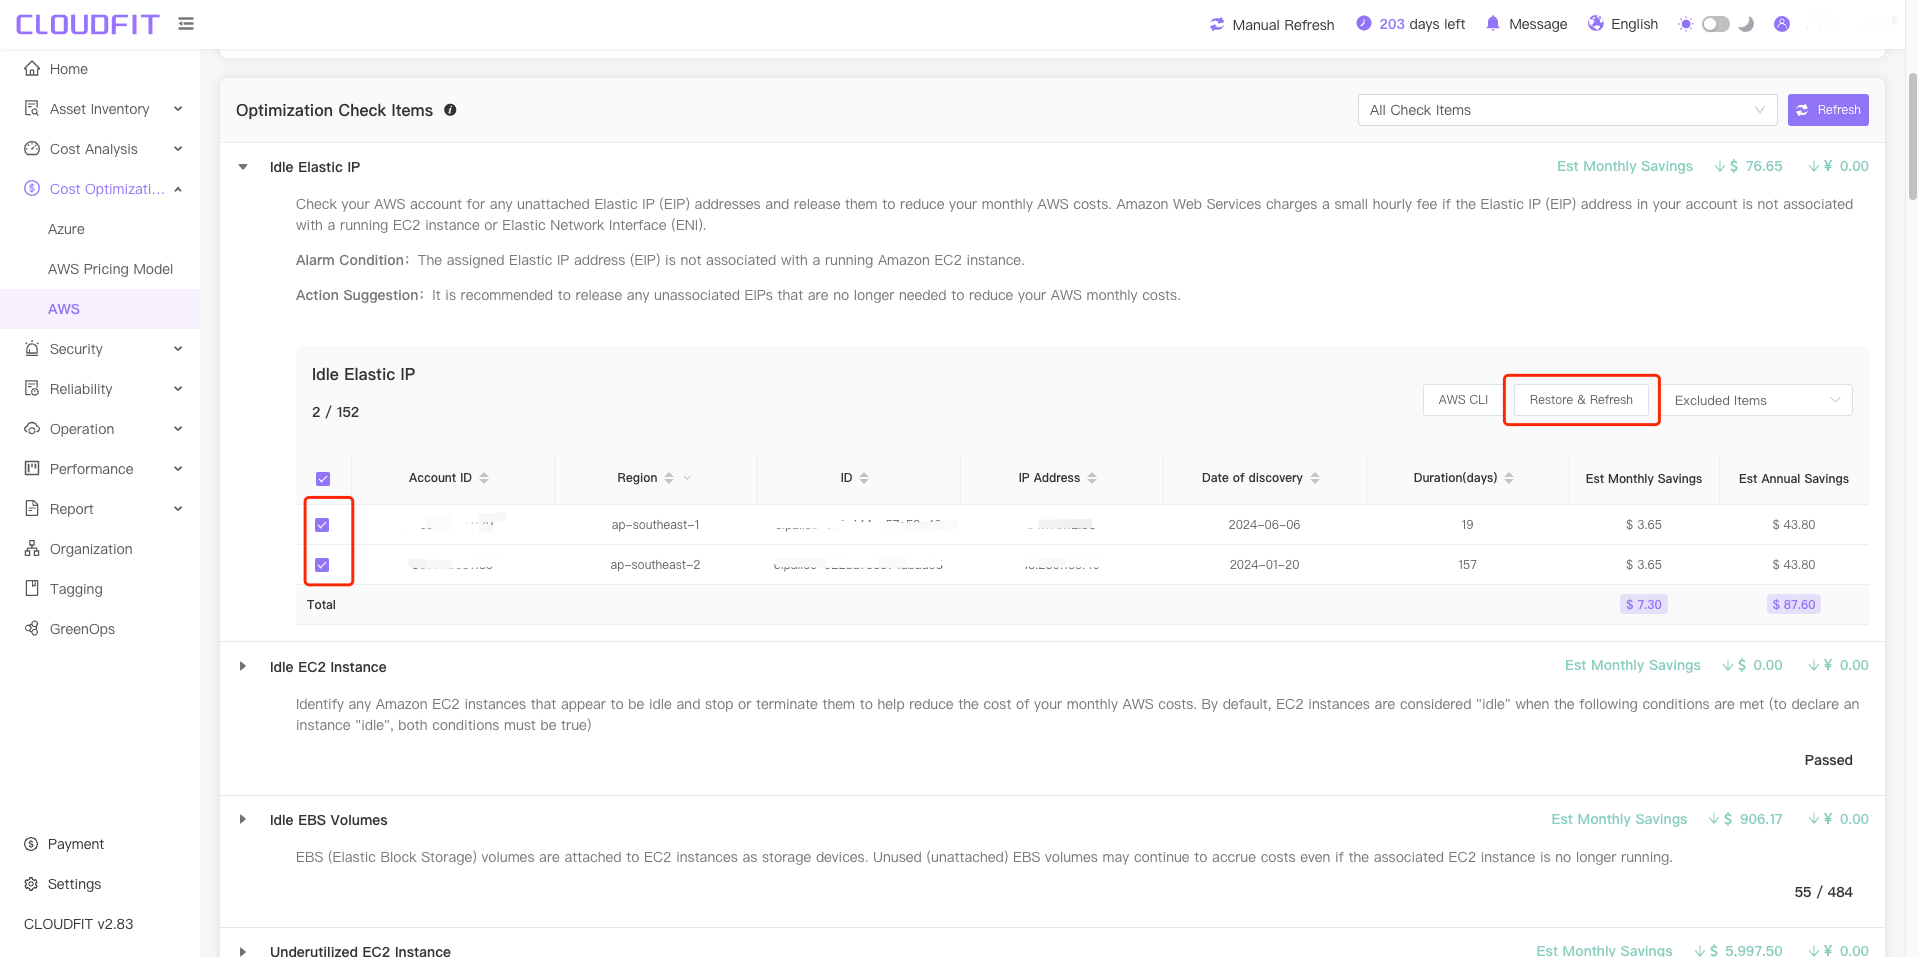
Restore Items
Following the same steps as above, select the items to be restored -> Click the Restore & Refresh button to restore successfully, as shown below:
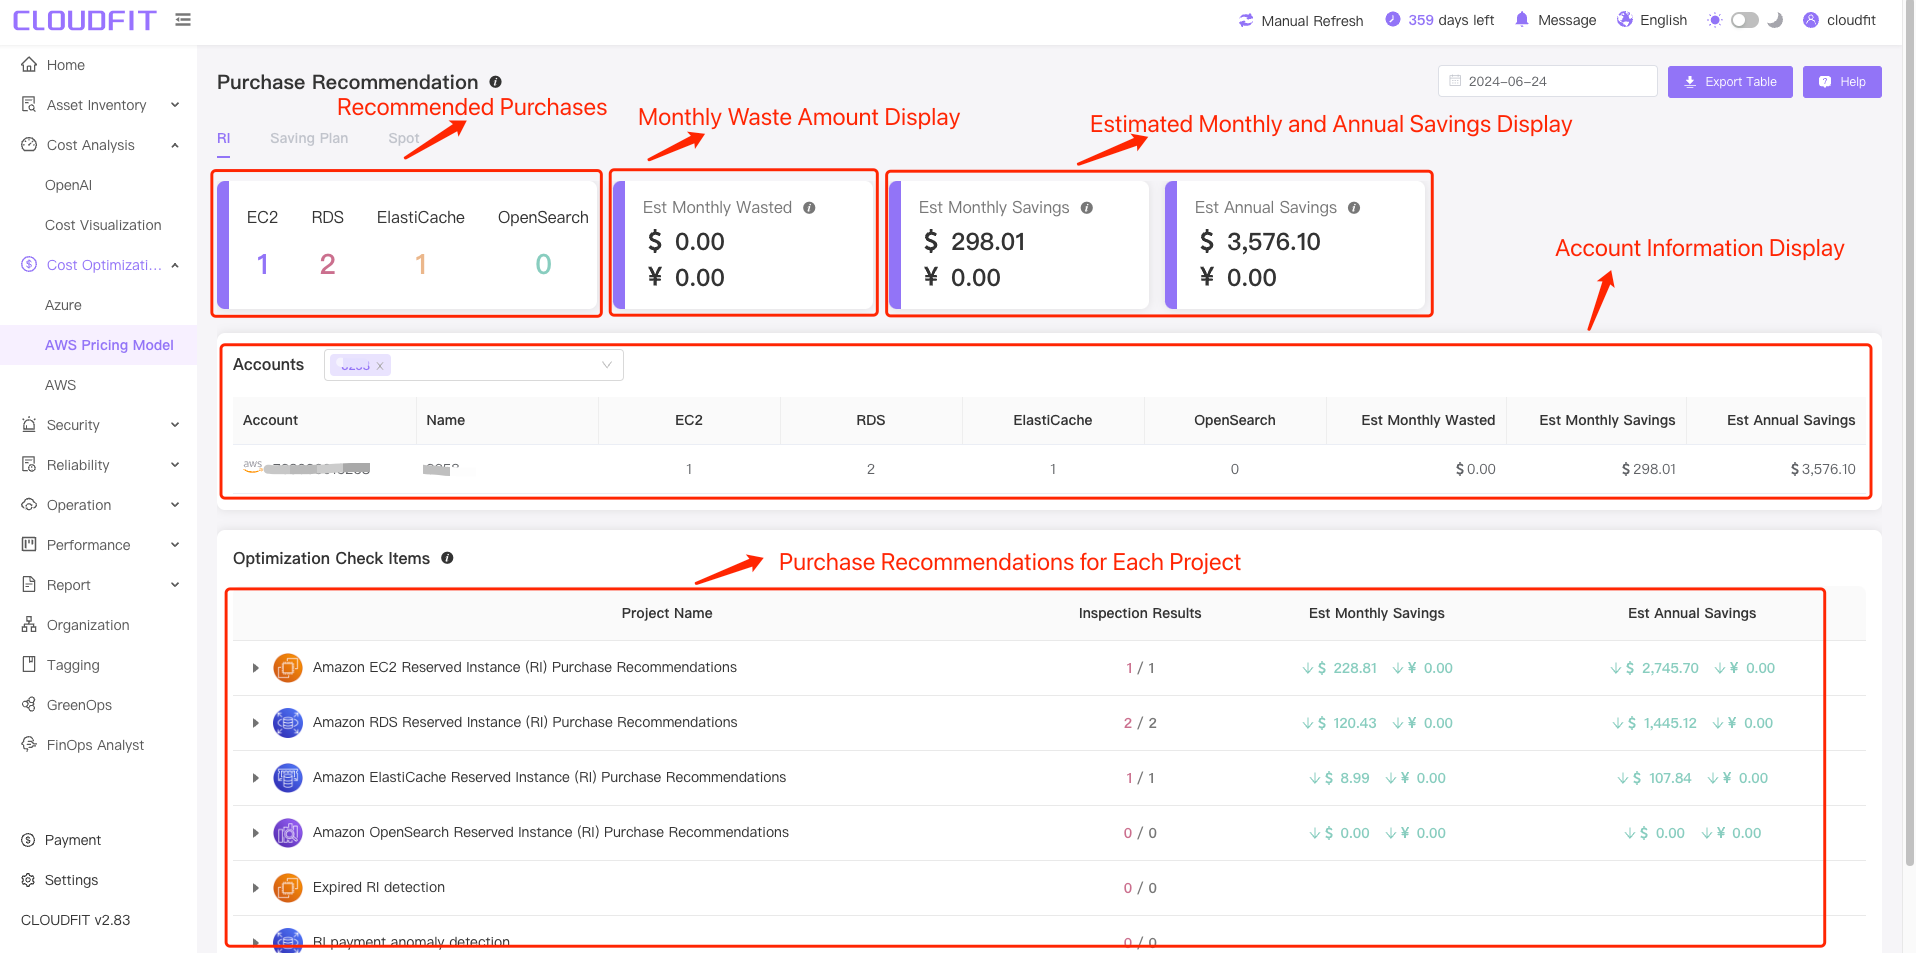
AWS Purchase Suggestions
Click on Cost Optimization -> AWS Purchase Suggestions in the navigation bar to enter the page, as shown below:
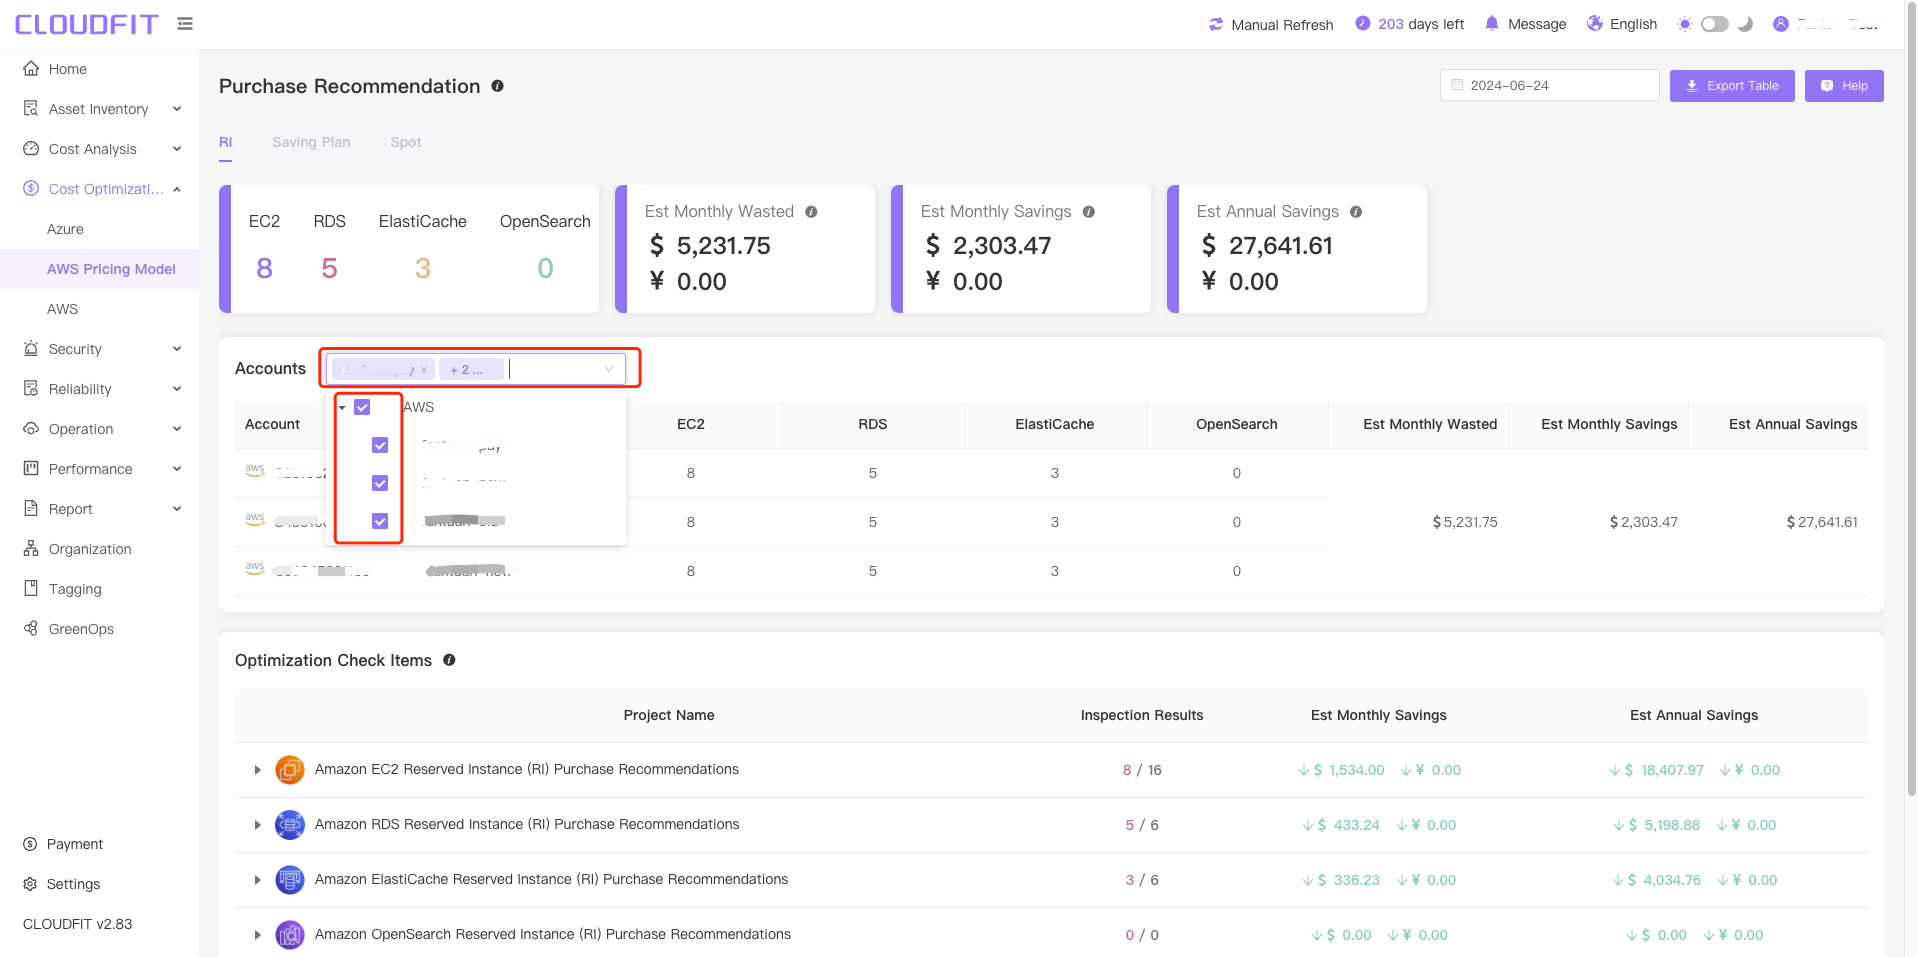
Account Filter
Click on the Account Filter Box to view the assets of one or multiple accounts, as shown below:
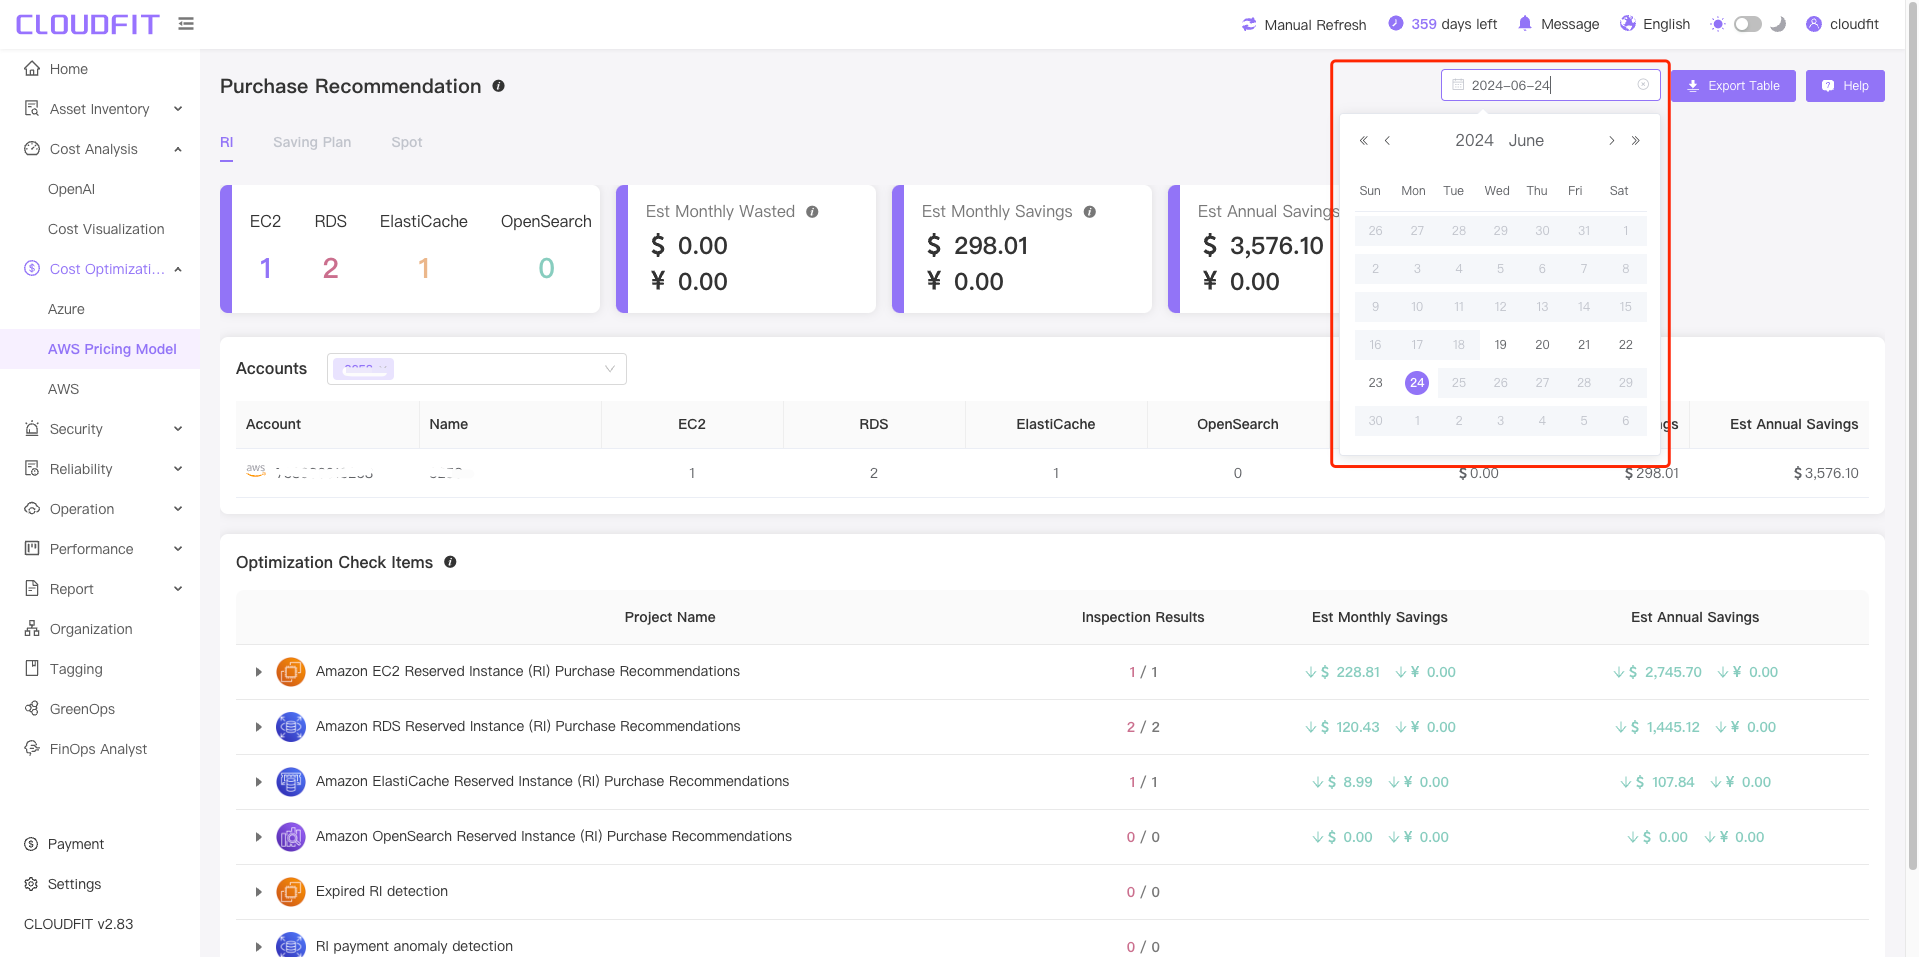
Date Filtering
You can query the asset status for any date, as shown below:
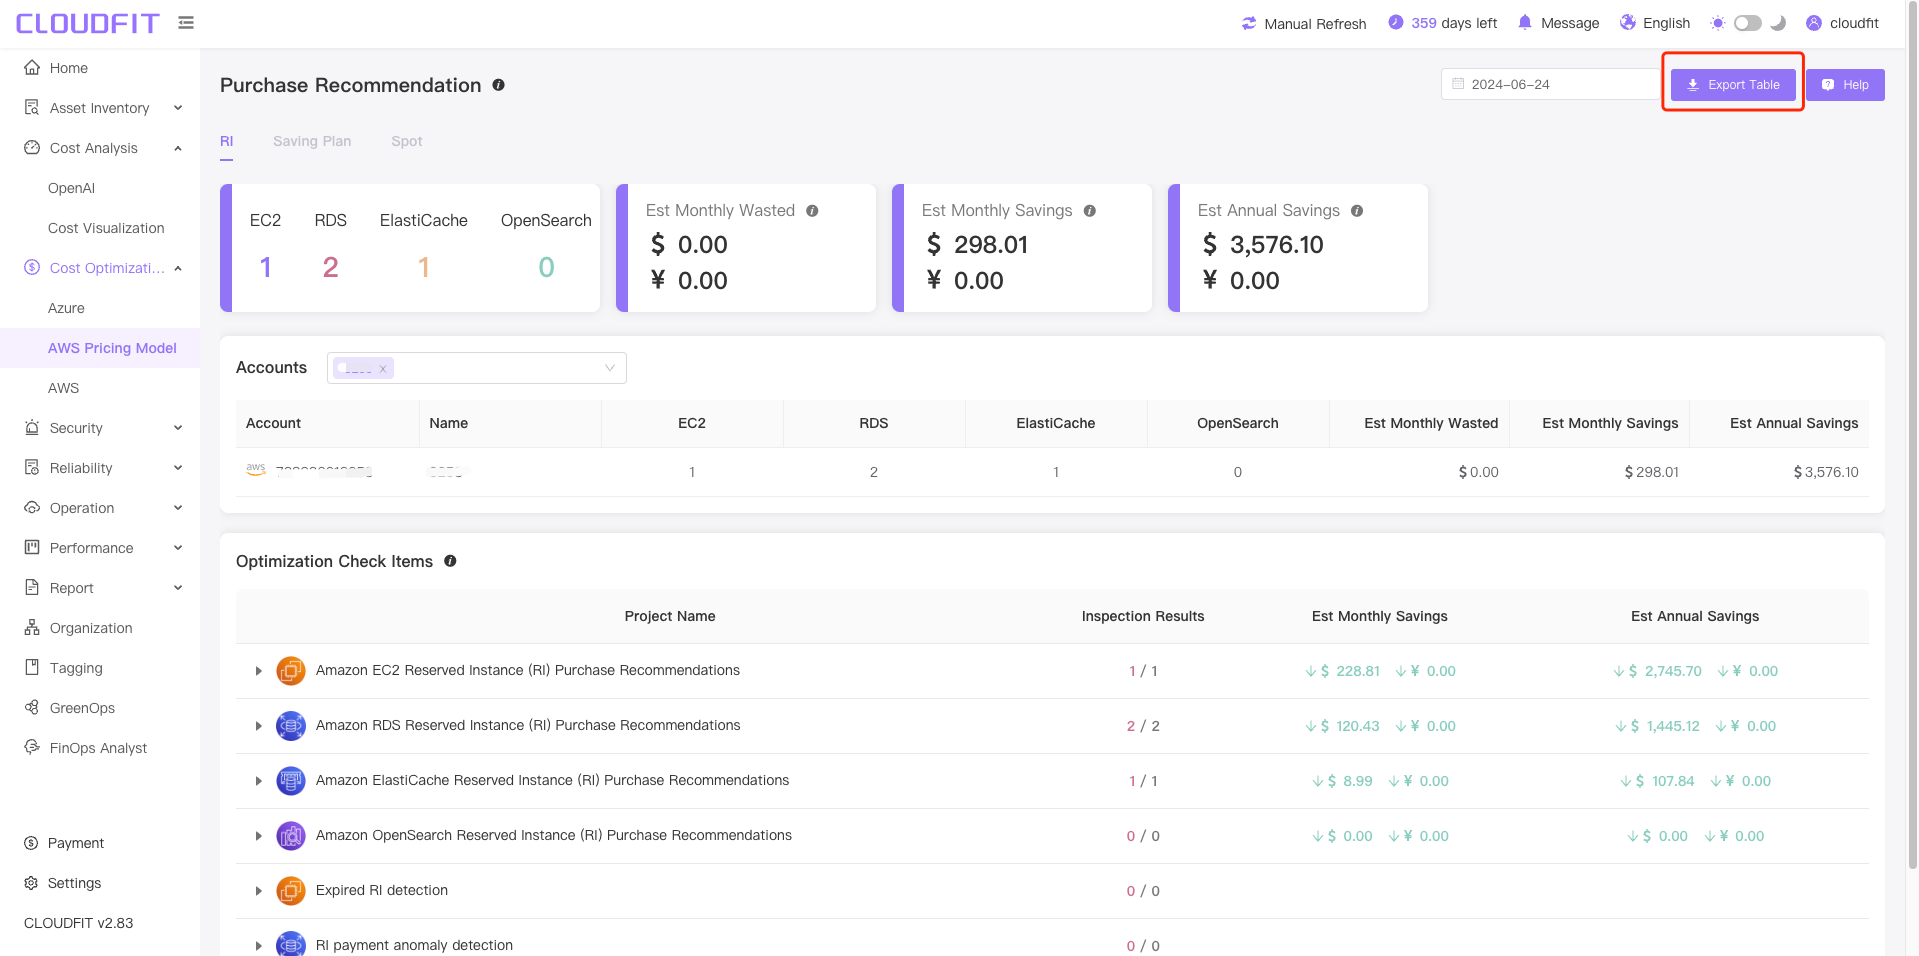
Export Purchase Suggestions to Excel
Click the Export Table icon to export all purchase suggestion data to Excel, as shown below:
AWS Saving Plan
Access the management console by navigating to Cost Optimization → AWS Savings Plans` in the left sidebar, as shown below:
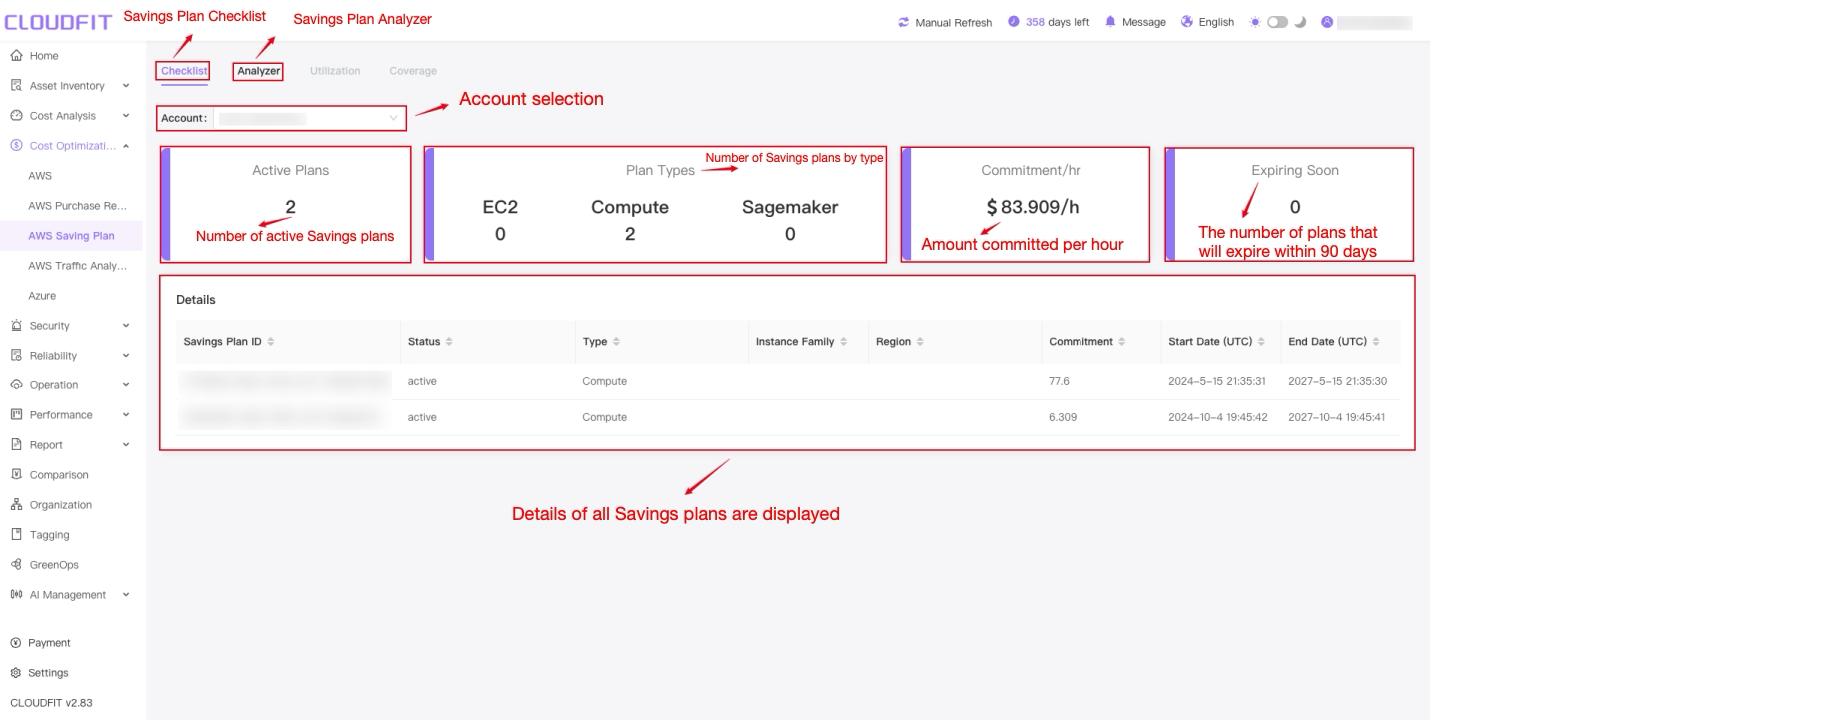
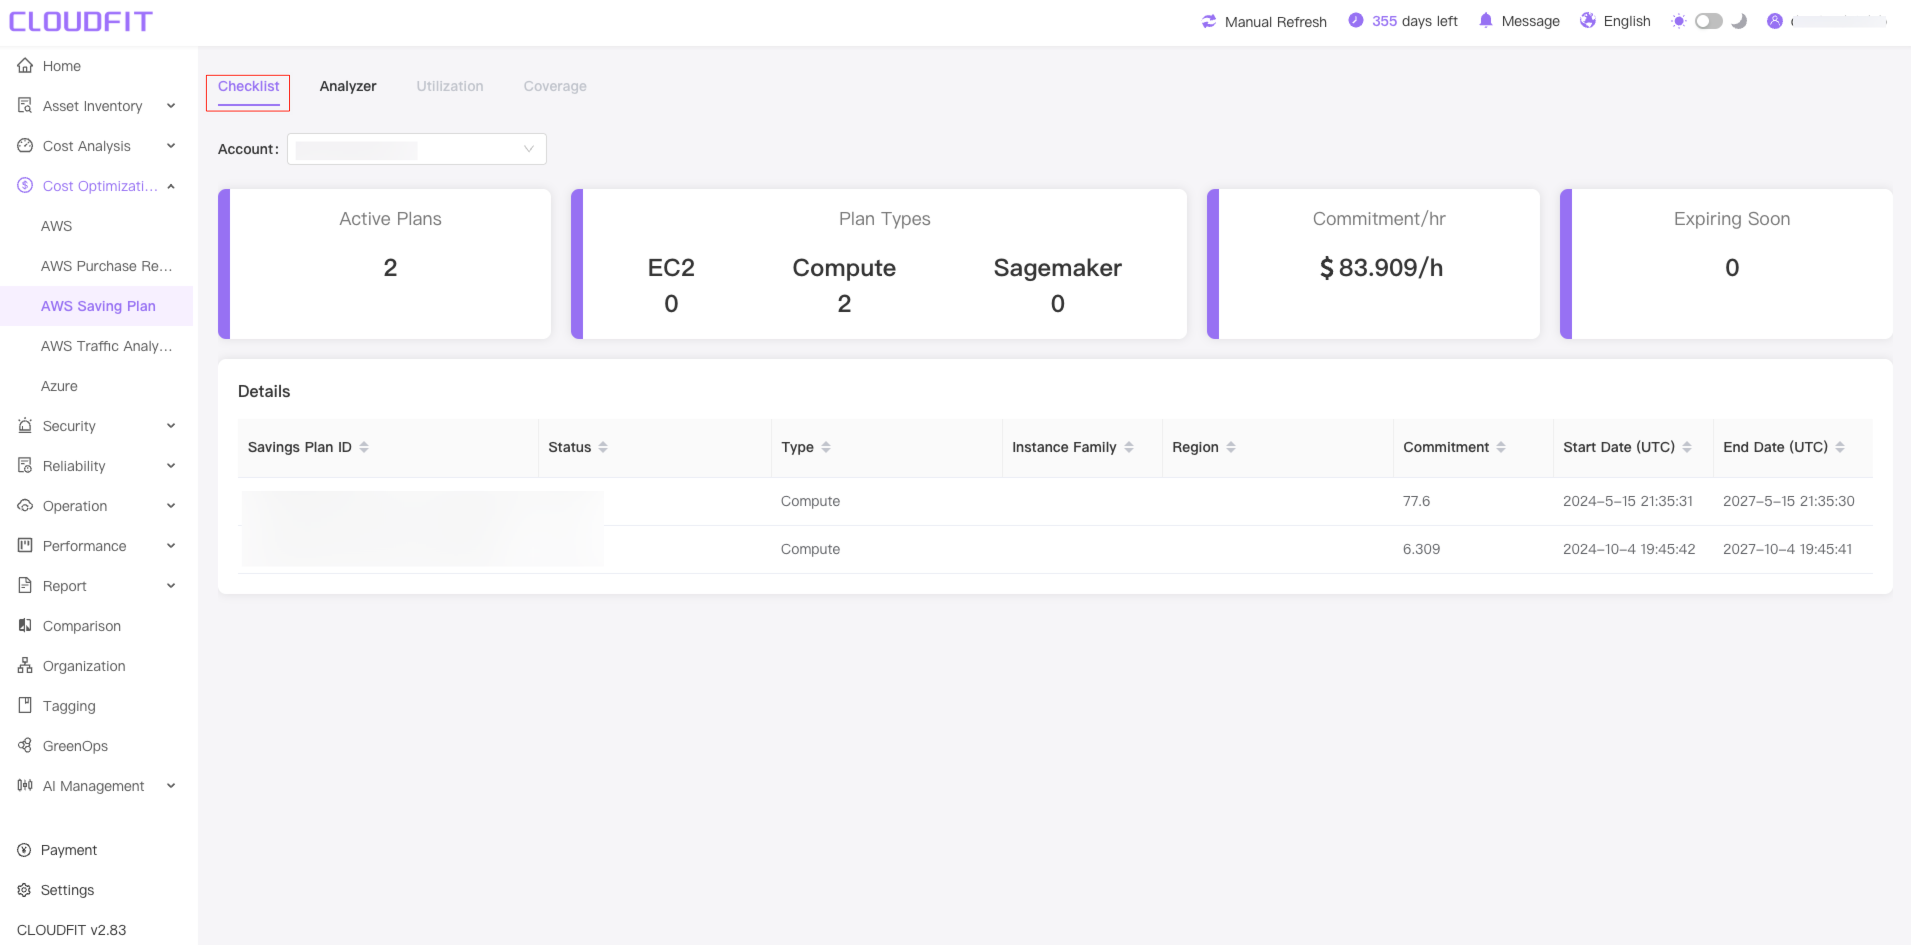
Checklist
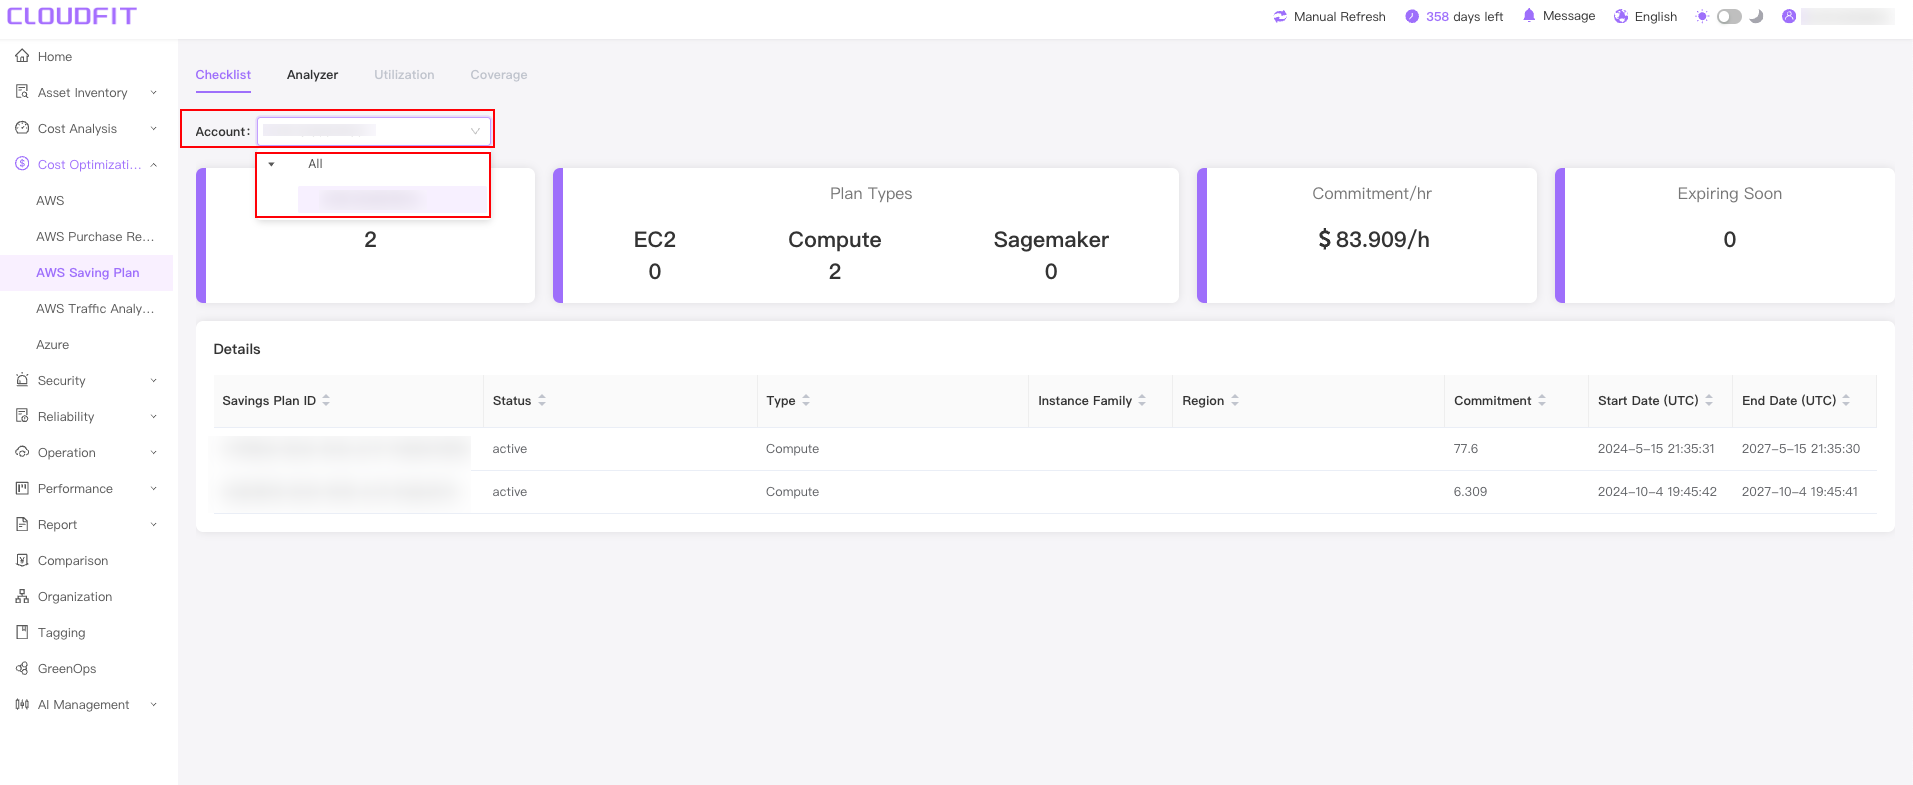
Click the Checklist button to view the usage status of all Savings Plans under the current account, as shown below:
Account Filter
Click the Account filter box ,Select the AWS account to be analyzed, and the system will refresh the corresponding Savings Plans in real time, as shown below:
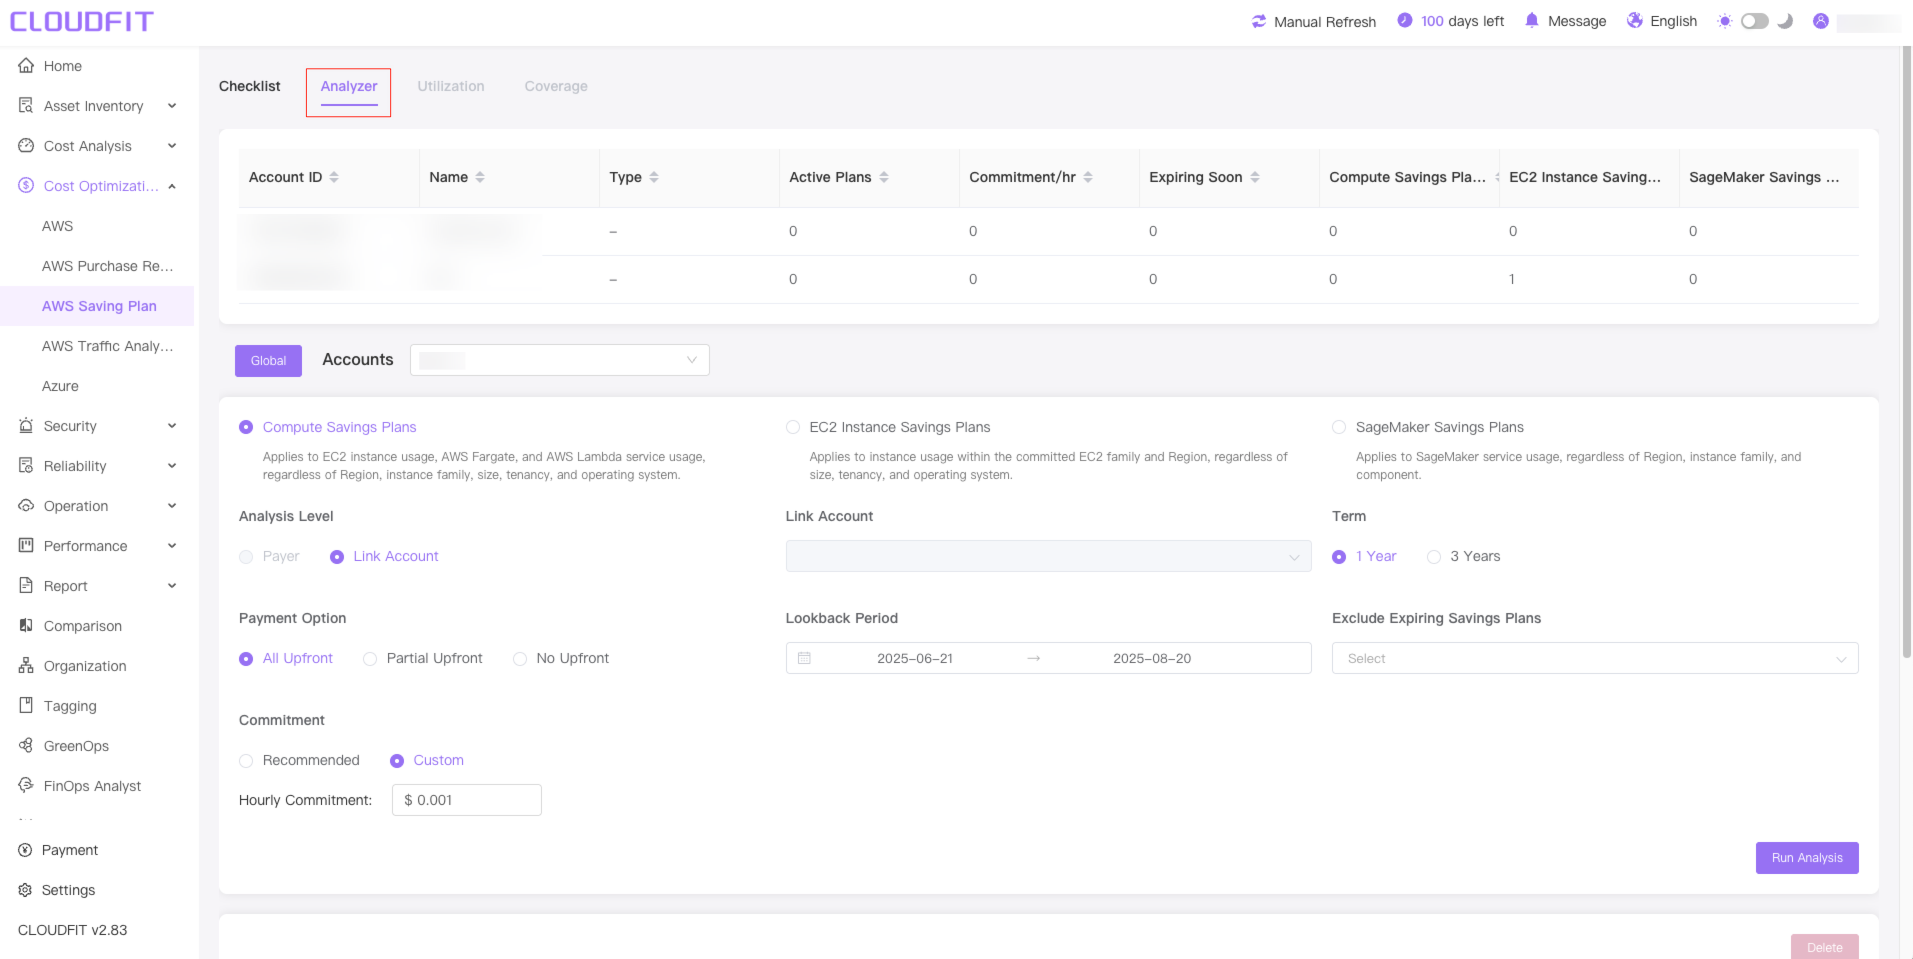
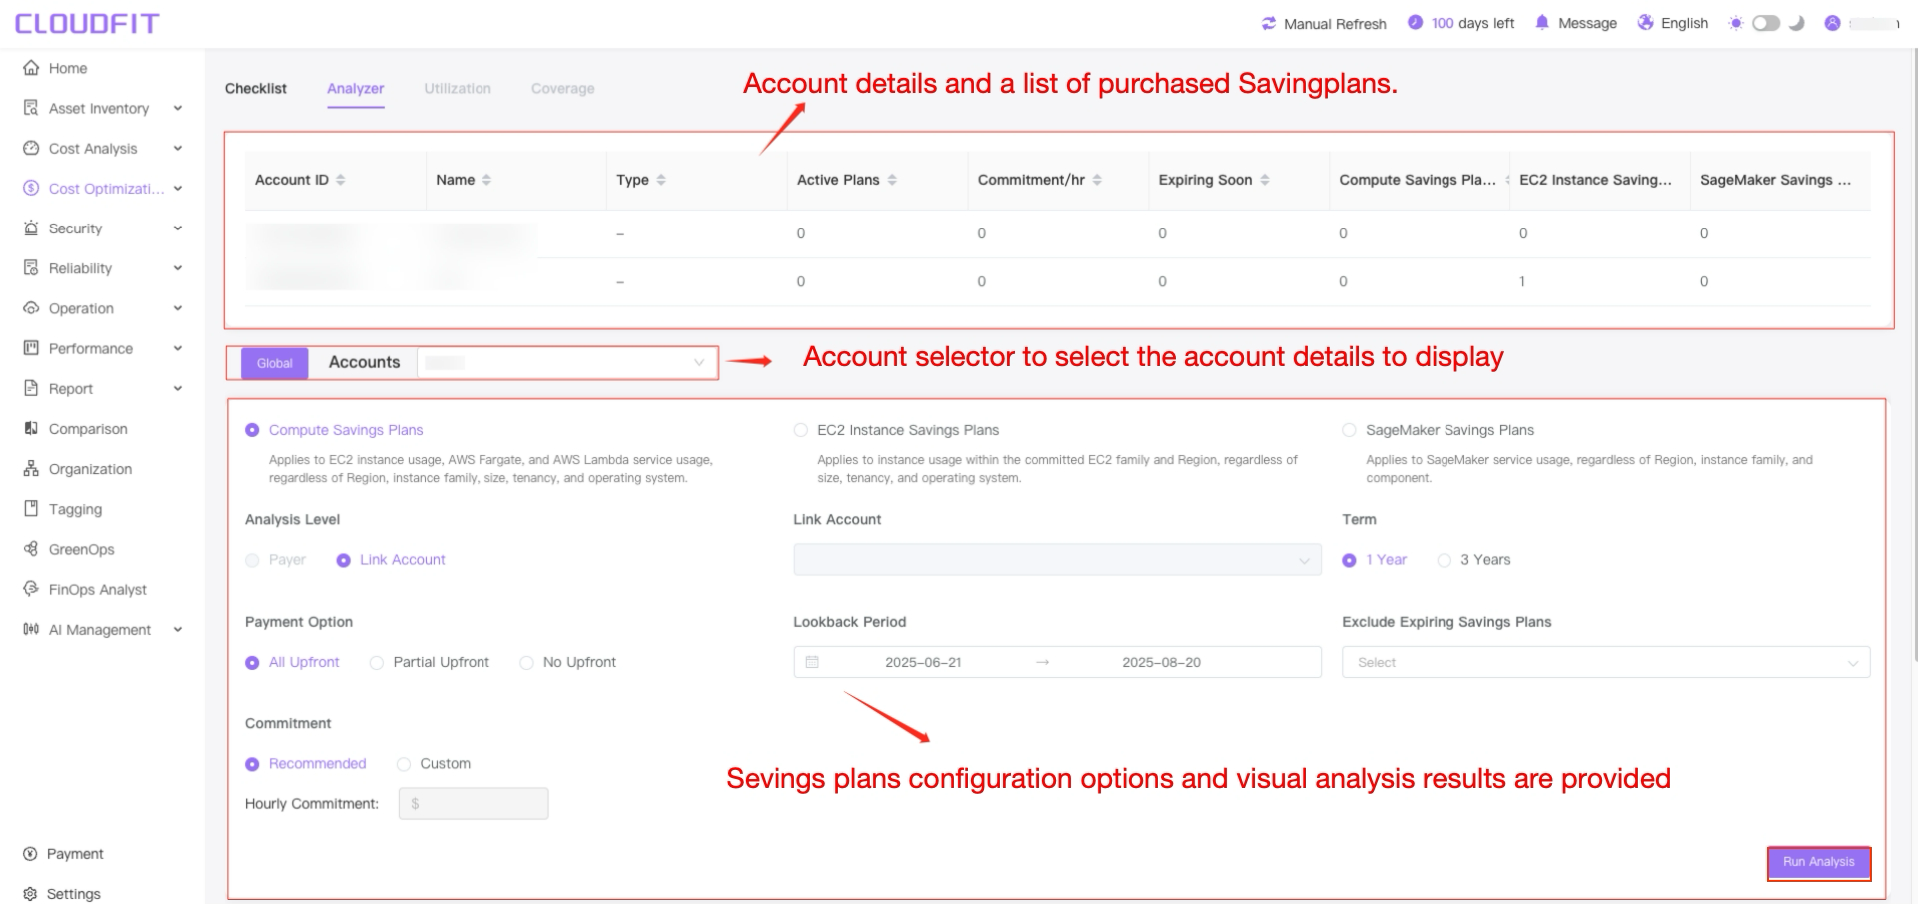
Analyzer
Click the Analyzer button to navigate to the analyzer page, as shown below:
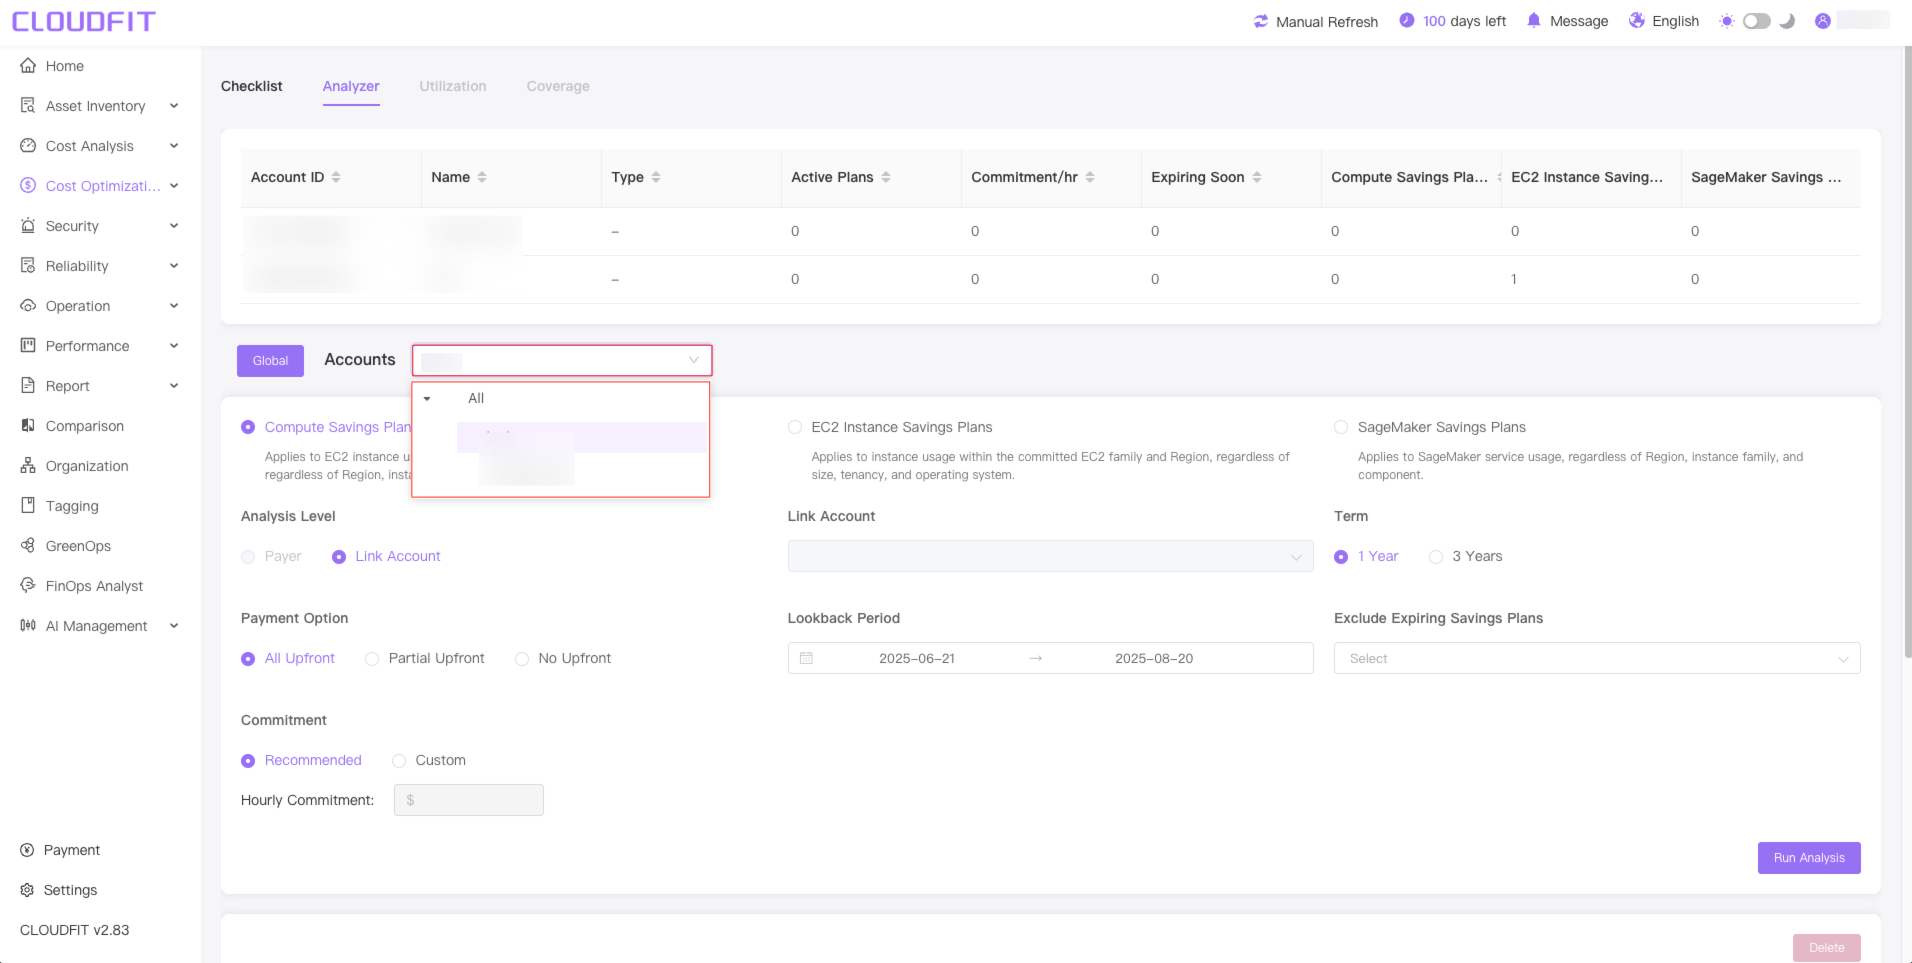
Account Filter
Use the Account Filter dropdown to select AWS accounts for analysis, as shown below:
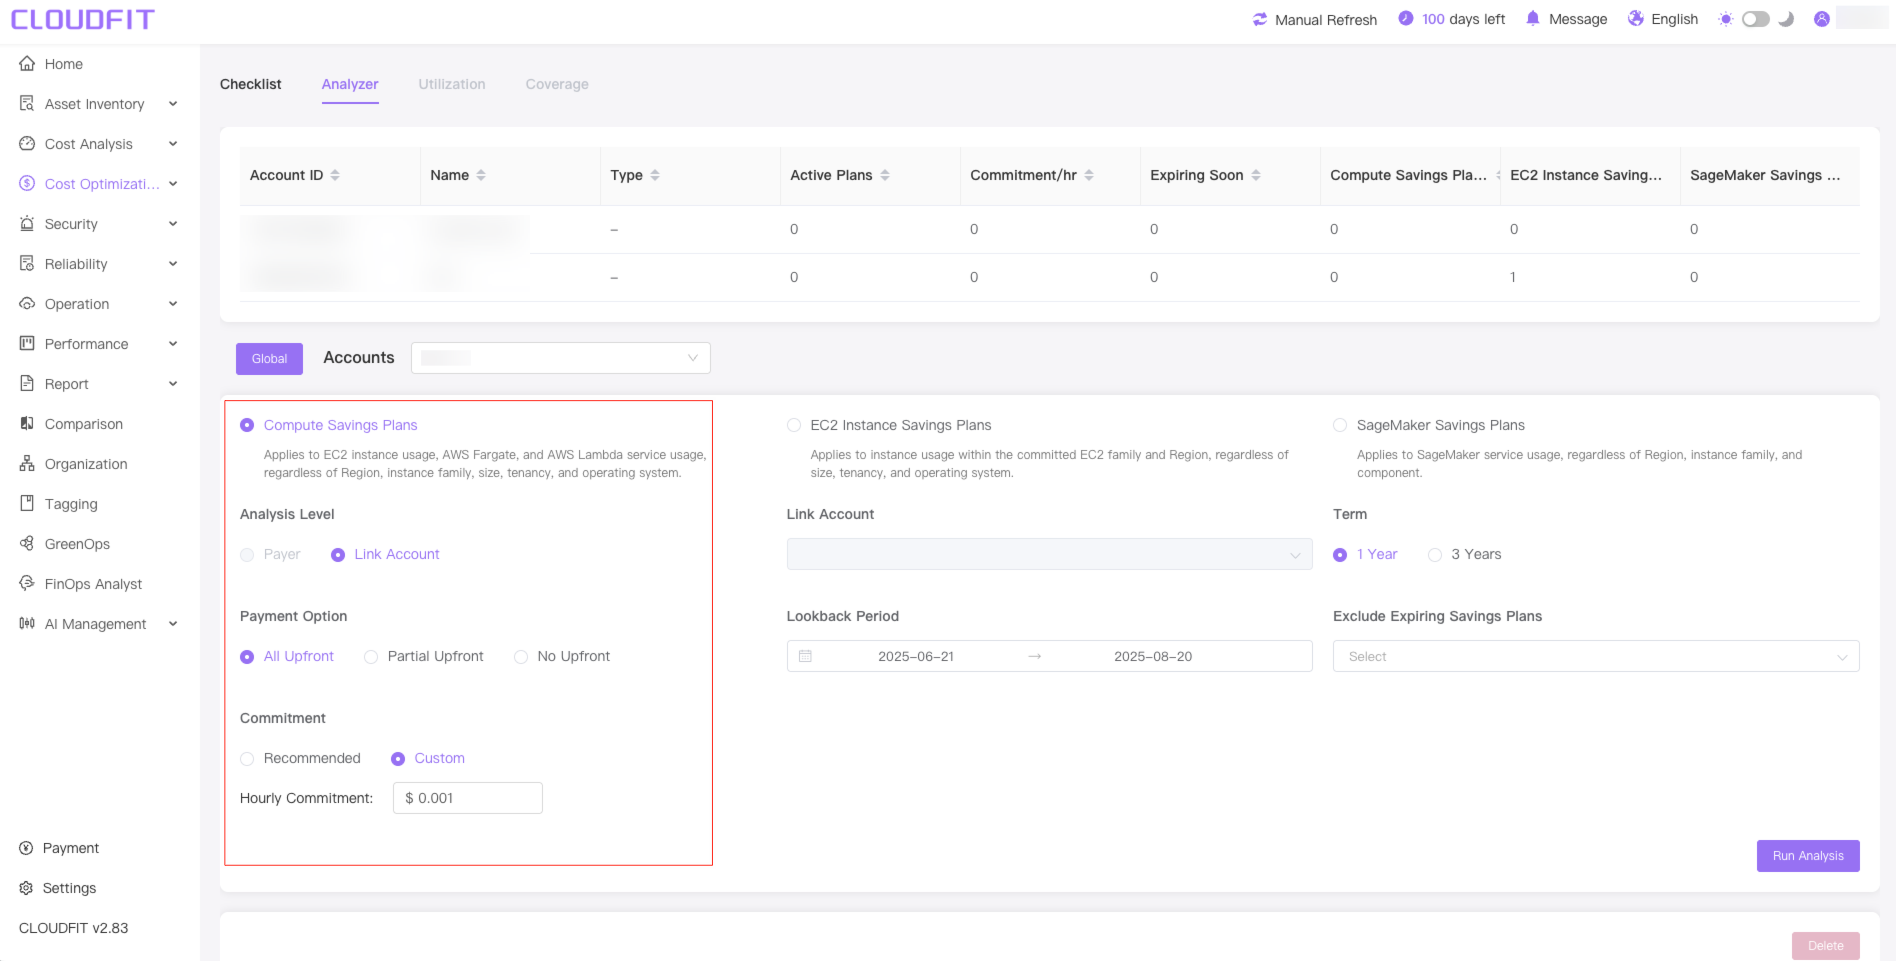
Compute Savings Plans
Click Compute Savings Plans, select Analysis Level-> Payment Option->Commitment, and the system will automatically calculate Commitment, as shown below:
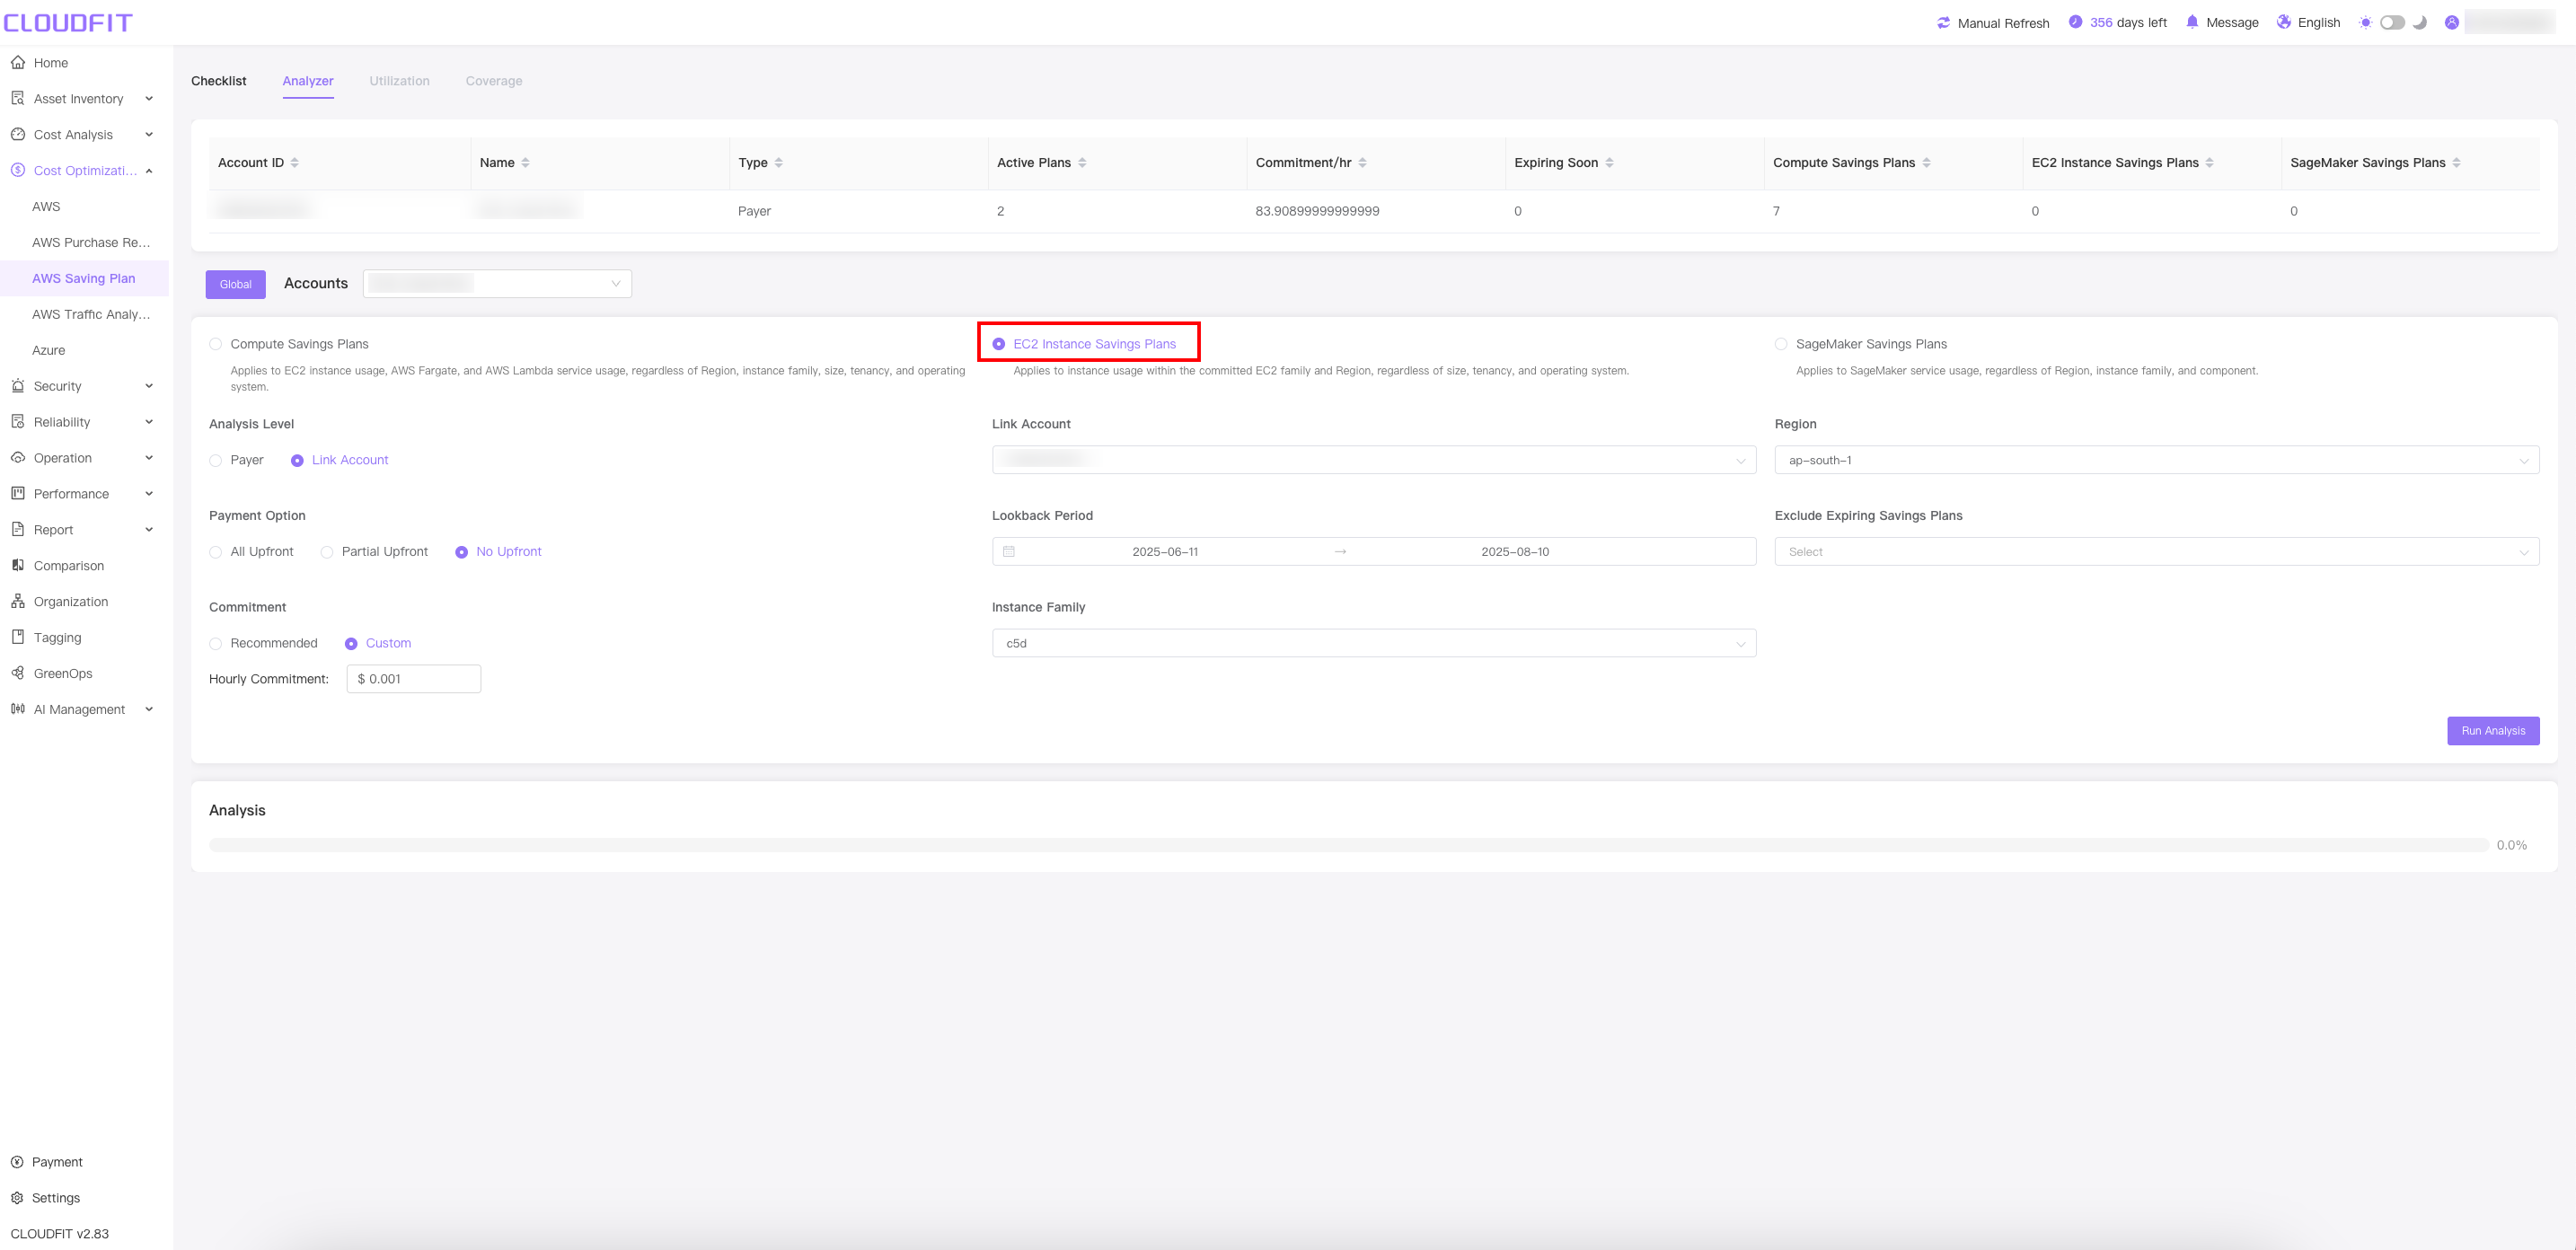
EC2 Instance Savings Plan
Click EC2 Instance Savings Plan button and switch to the EC2 Instance Savings Plan type, as shown below:
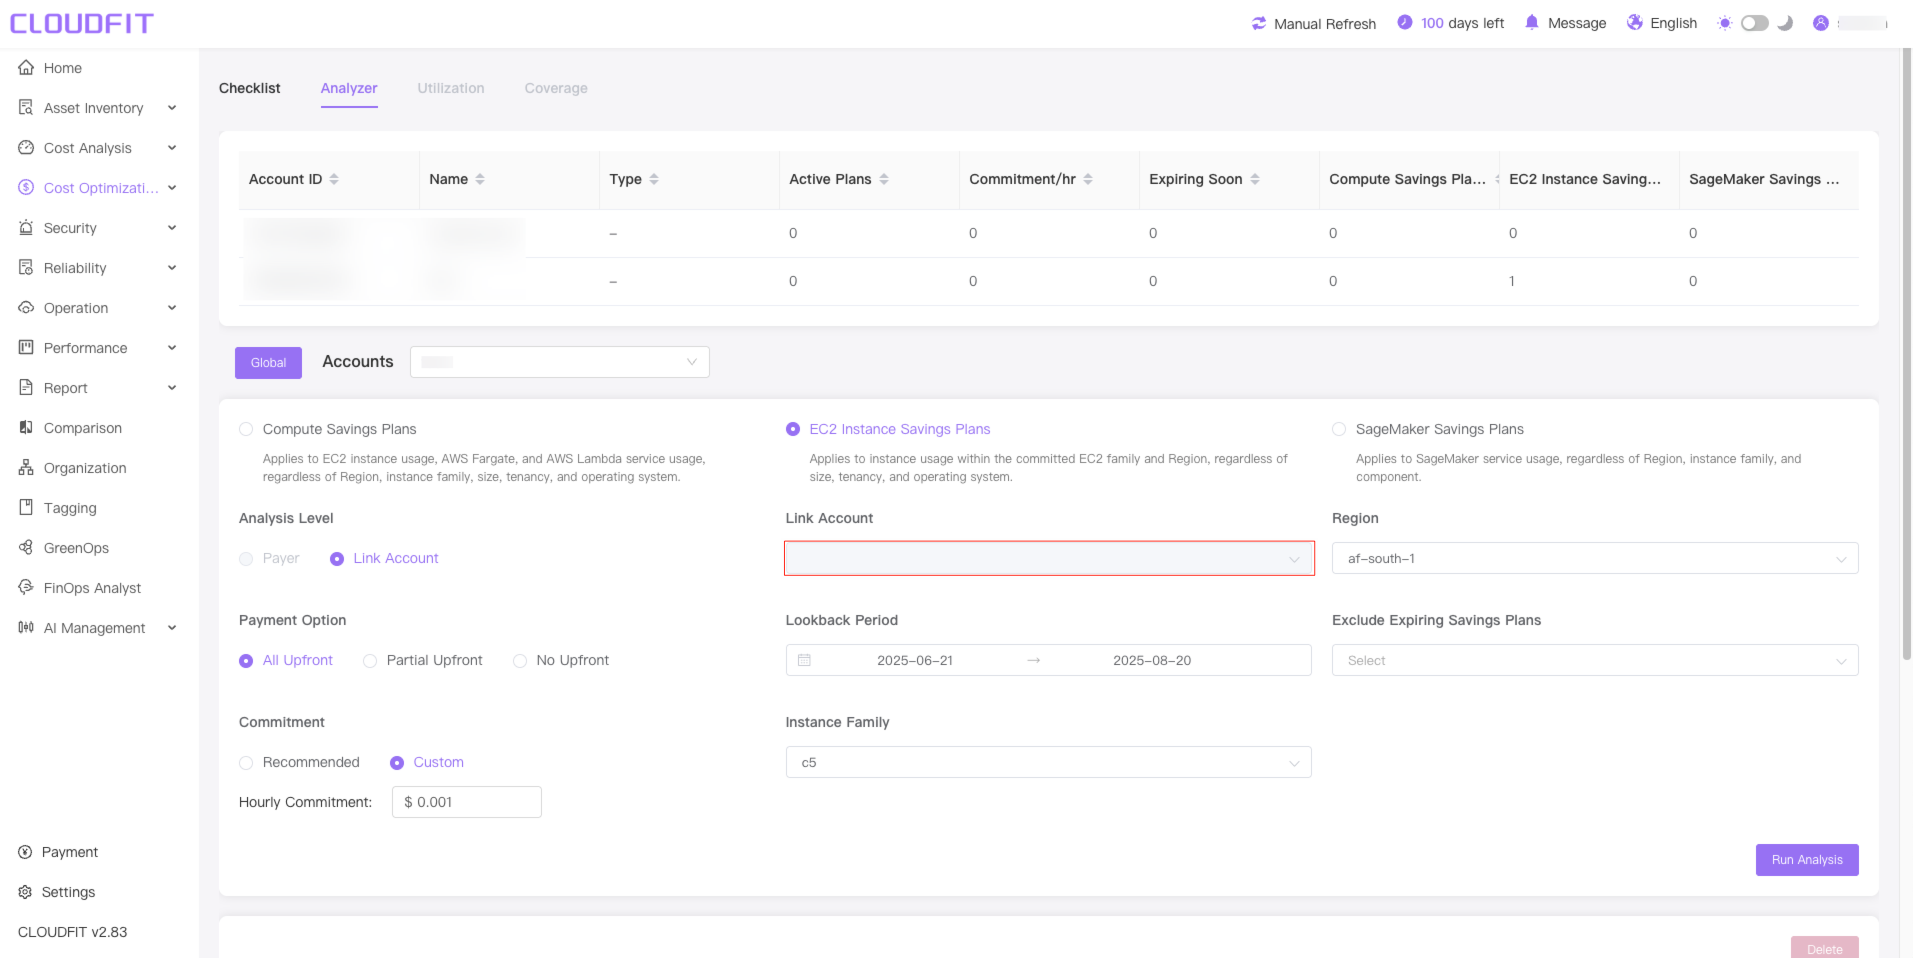
Associated account Filter
Click Link Account box to filter related accounts, as shown below:
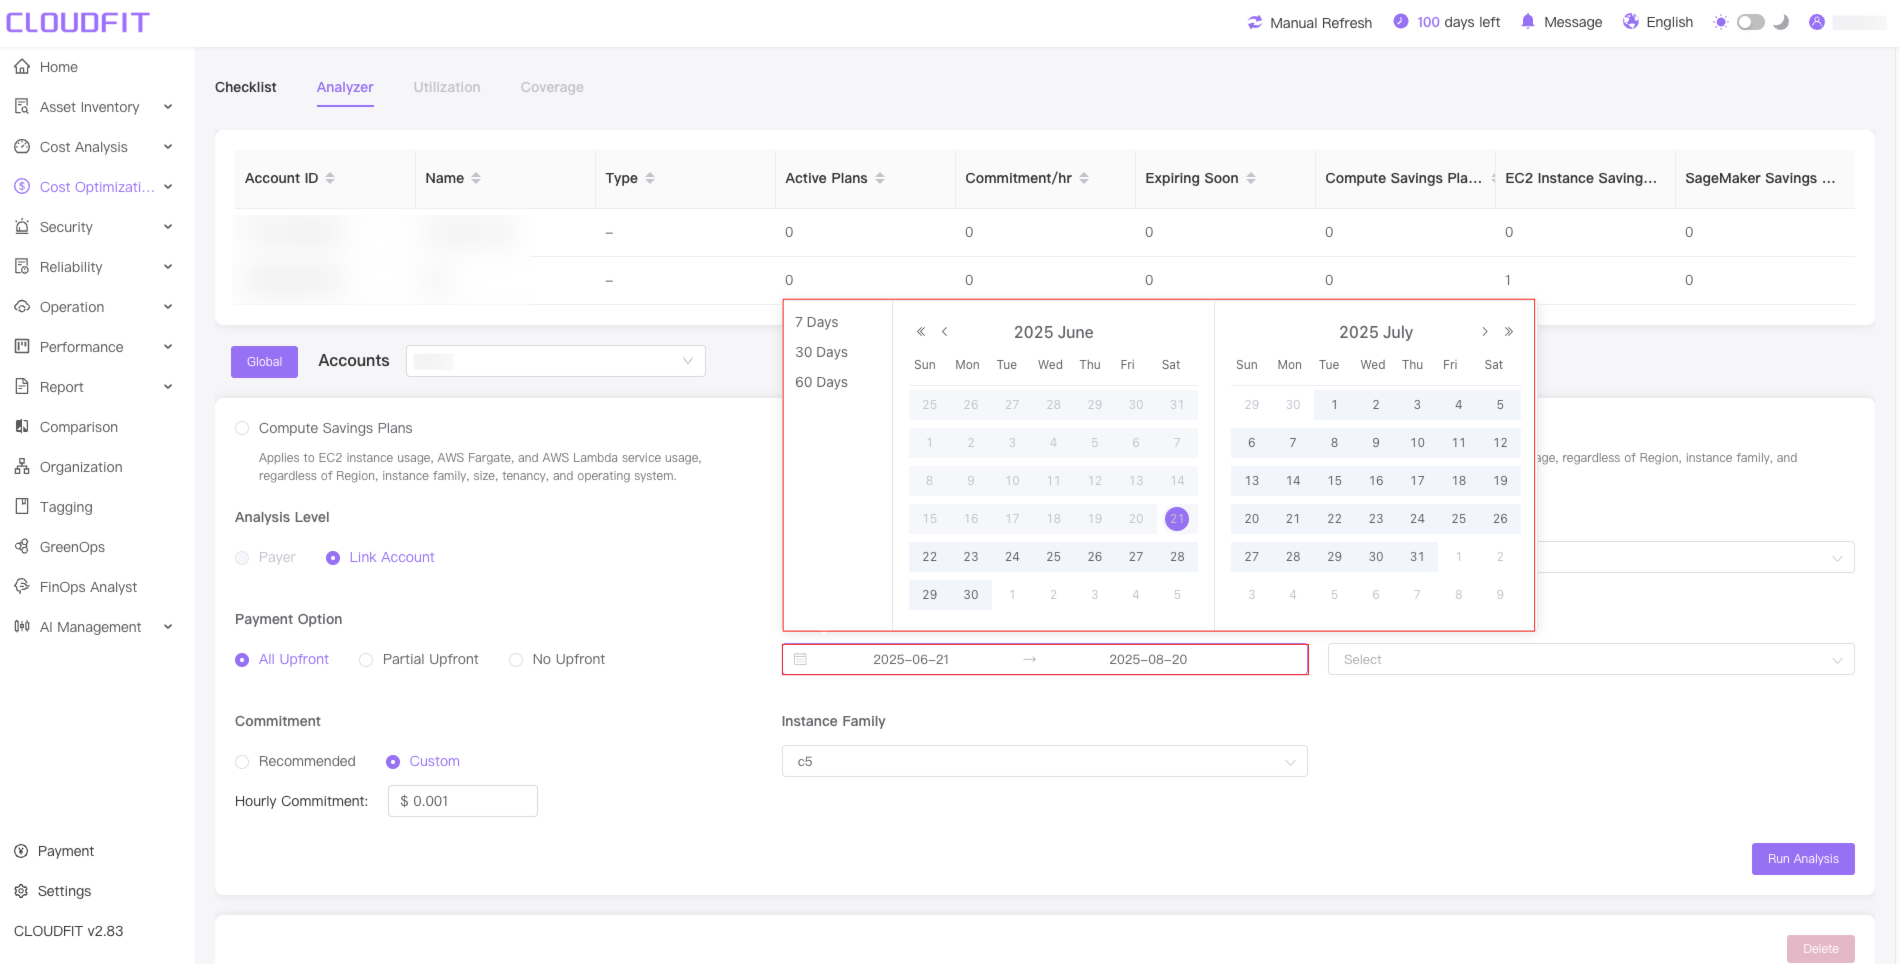
Lookback Period
You can choose a time range of up to 60 days,as shown below:
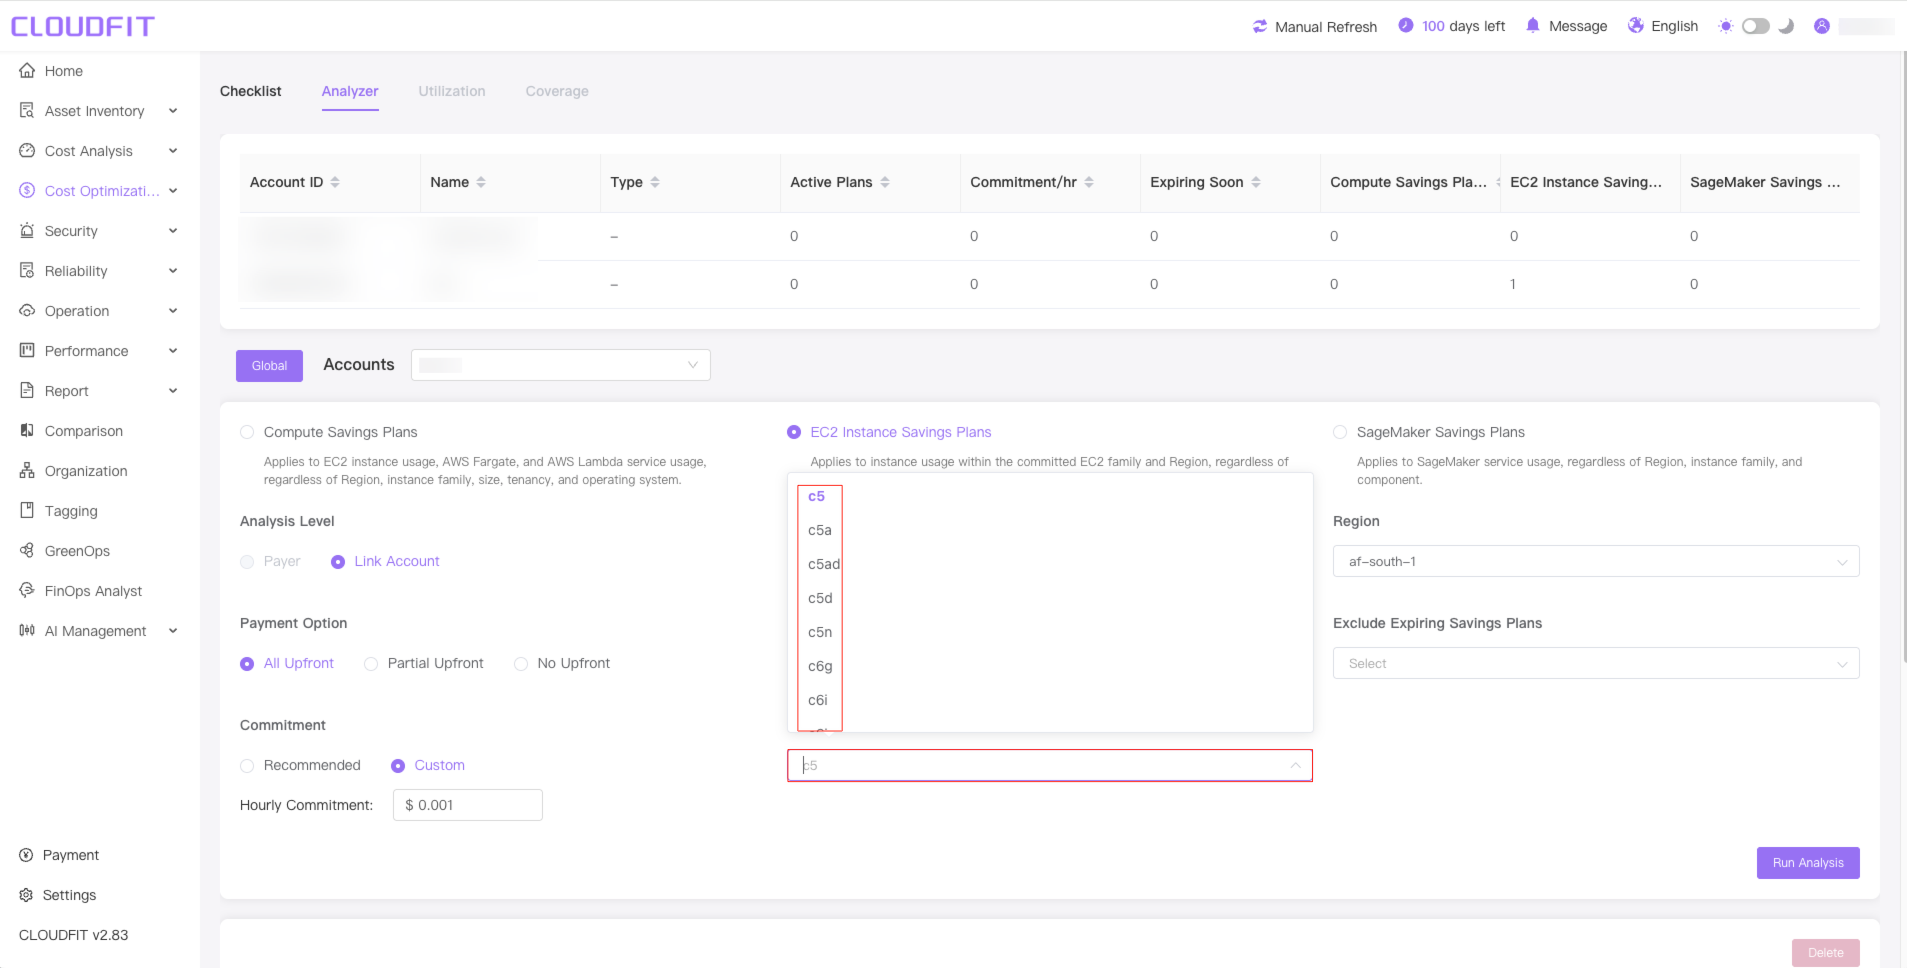
Instance Family
Dynamically display the supported EC2 instance series of the region based on the selected link account and the actual scope, as shown below:
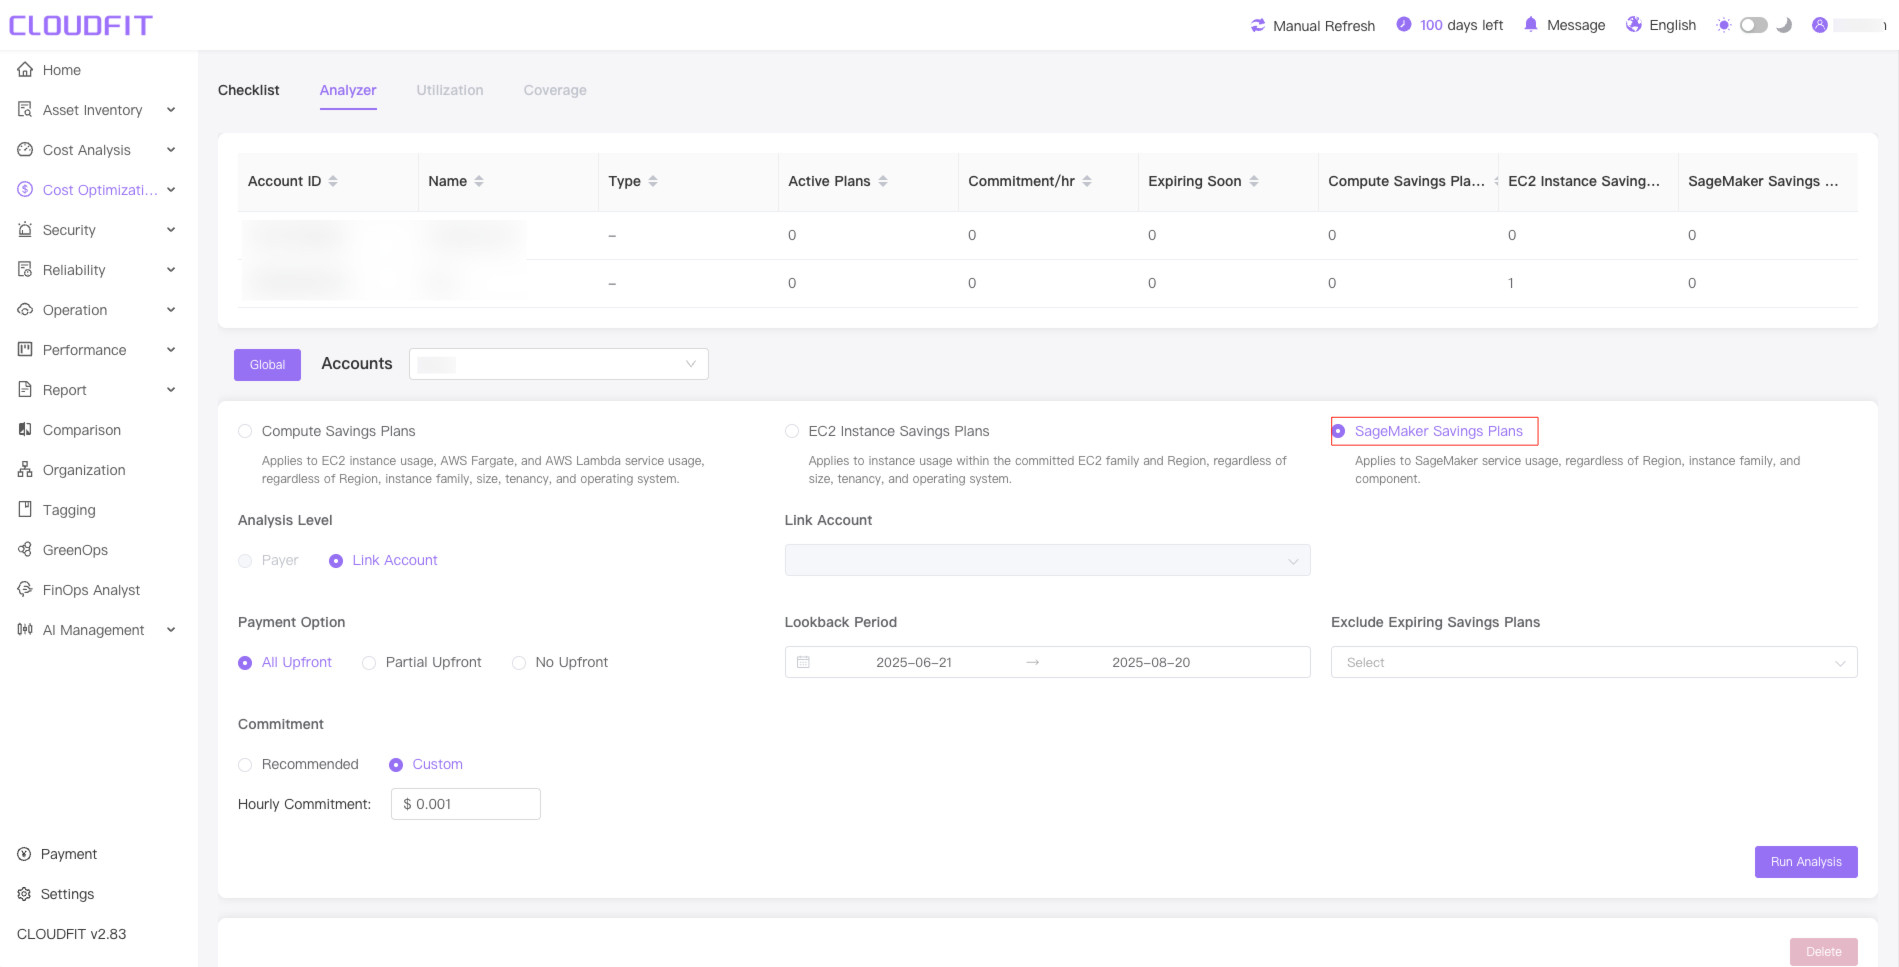
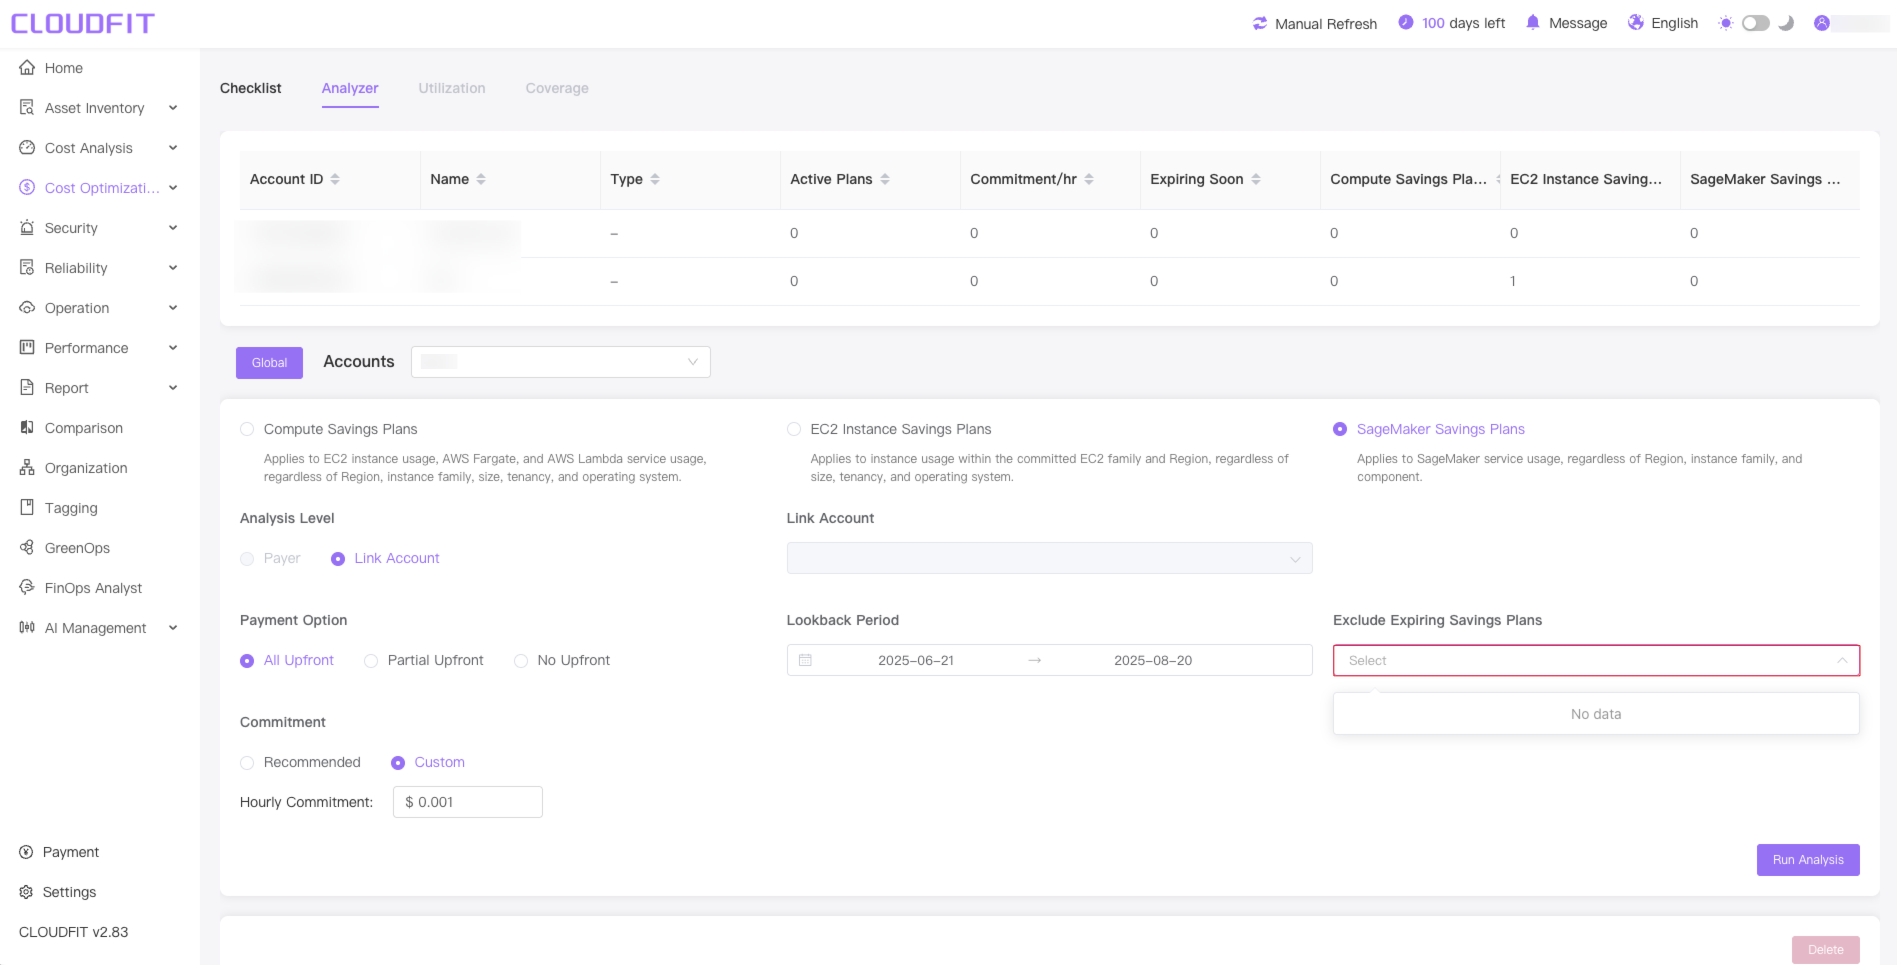
SageMaker Savings Plans
Click SageMaker Savings Plans to switch to the type of service that works for SageMaker, as shown below:
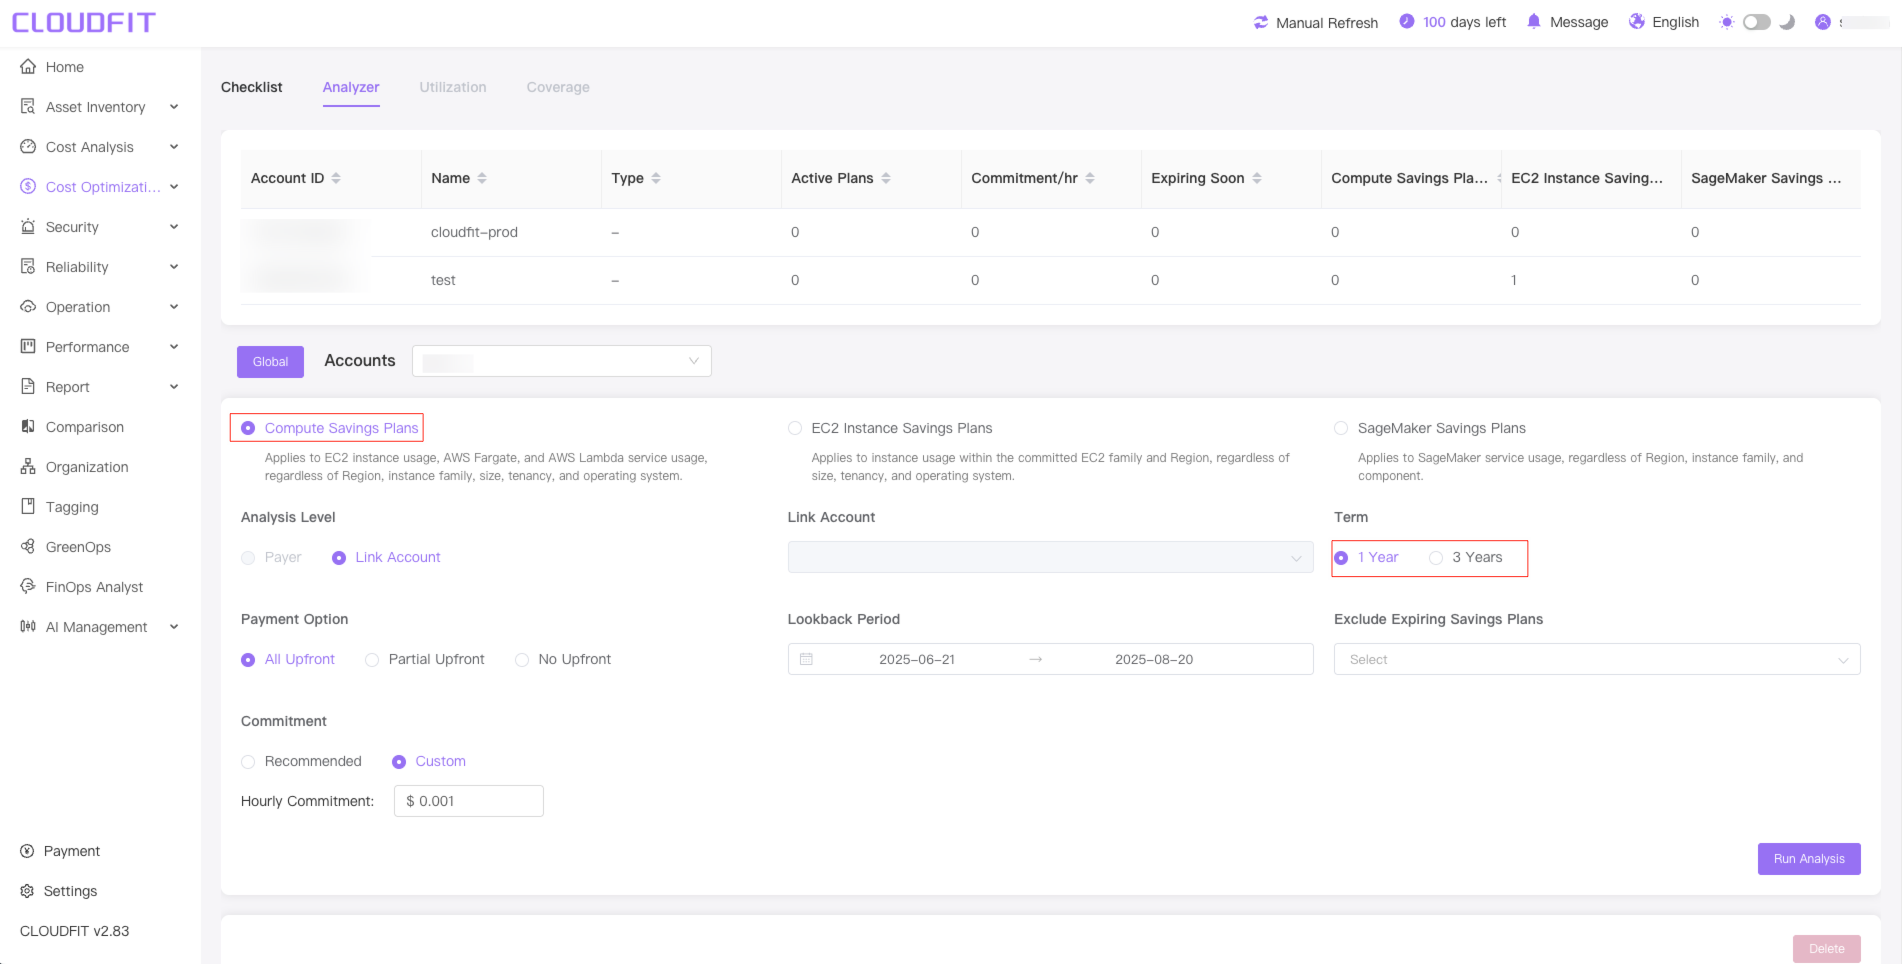
Term
Displayed when the user selects the Compute Savings Plans type One or three years are optional(Only Compute Savings Plans are visible), as shown below:
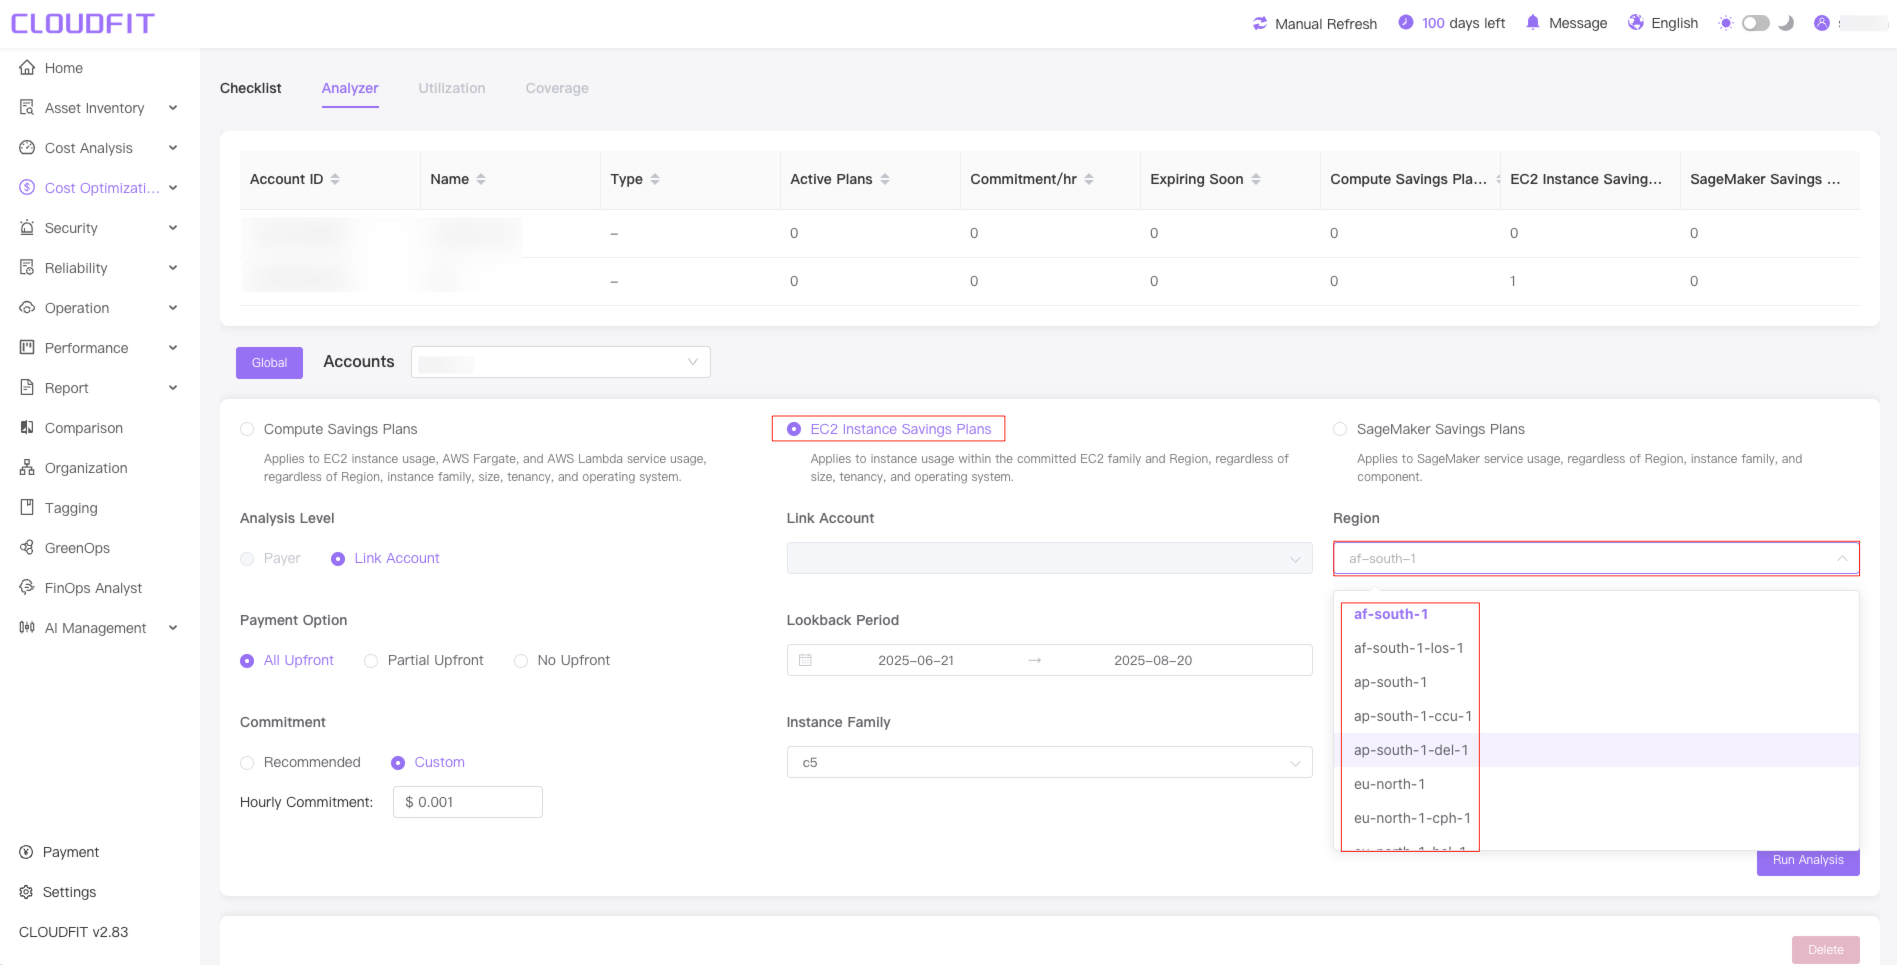
When the EC2 Instance Savings Plan type is selected, all AWS regions are displayed(Applicable to EC2 Instance Savings Plan only), as shown below:
Exclude Expiring Savings Plans
Check exclude plans that expire within 90 days
Analysis
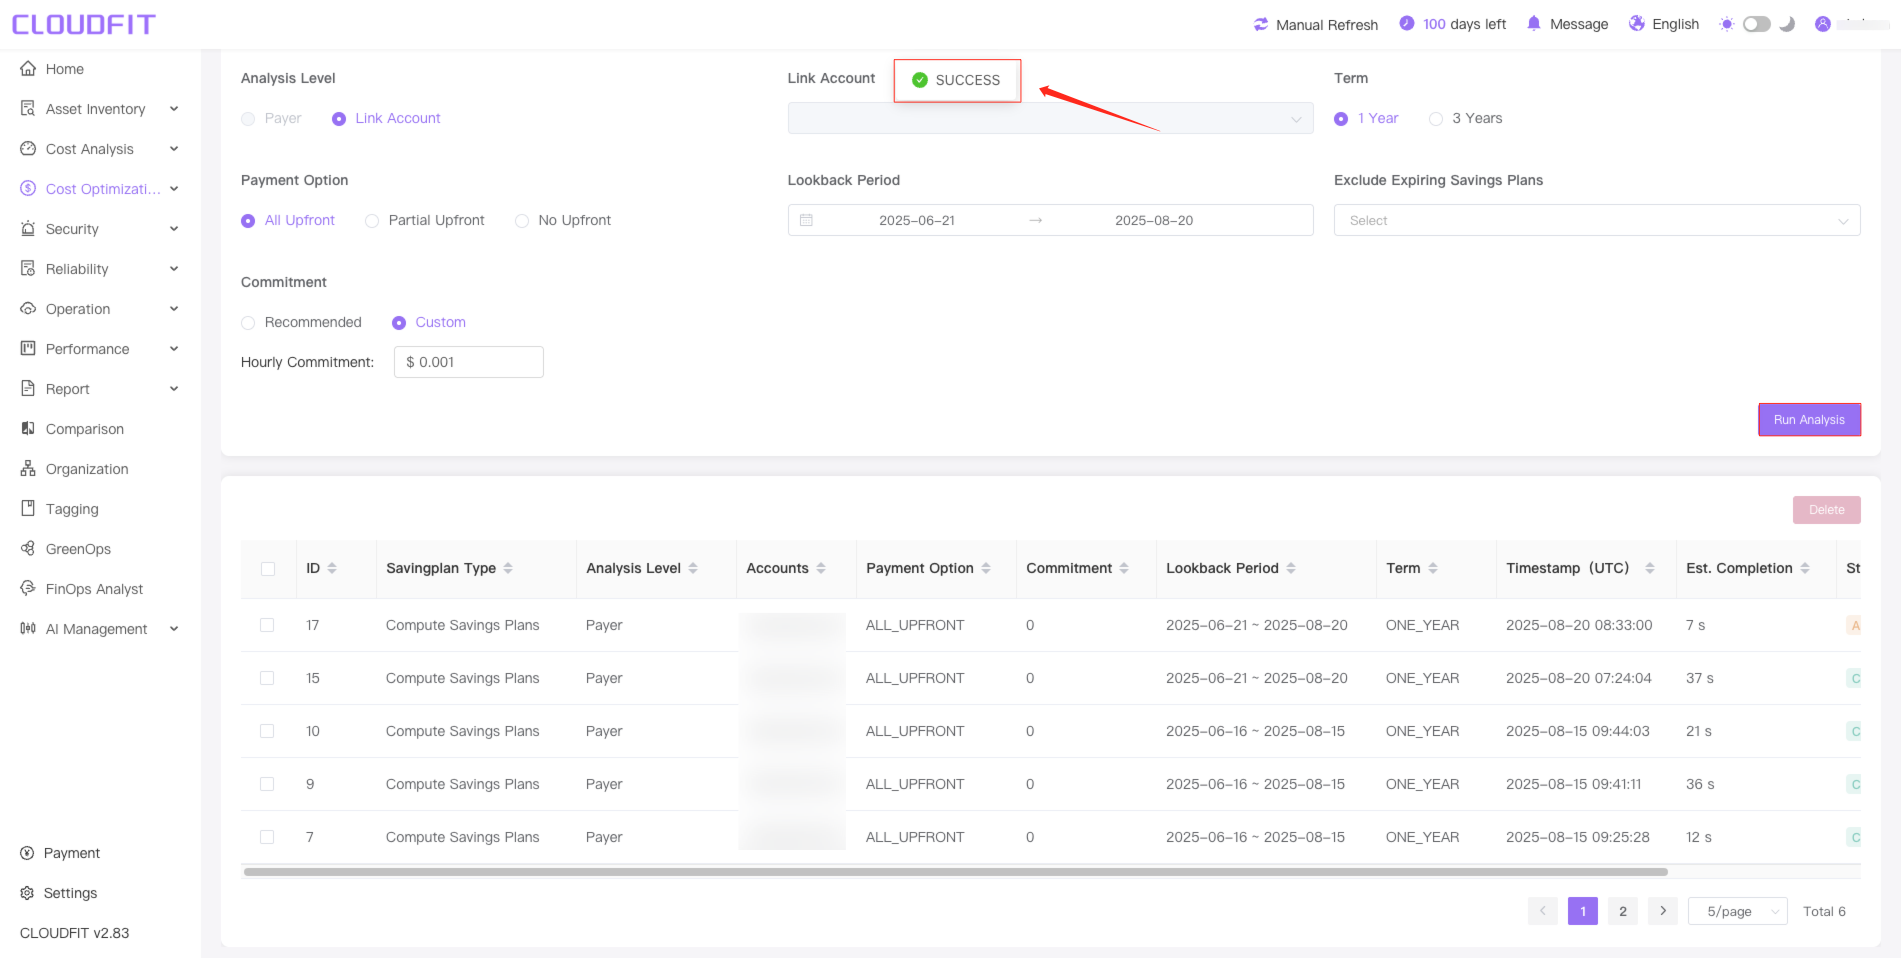
Click the Run Analysis button and wait for the analysis to finish, as shown below:
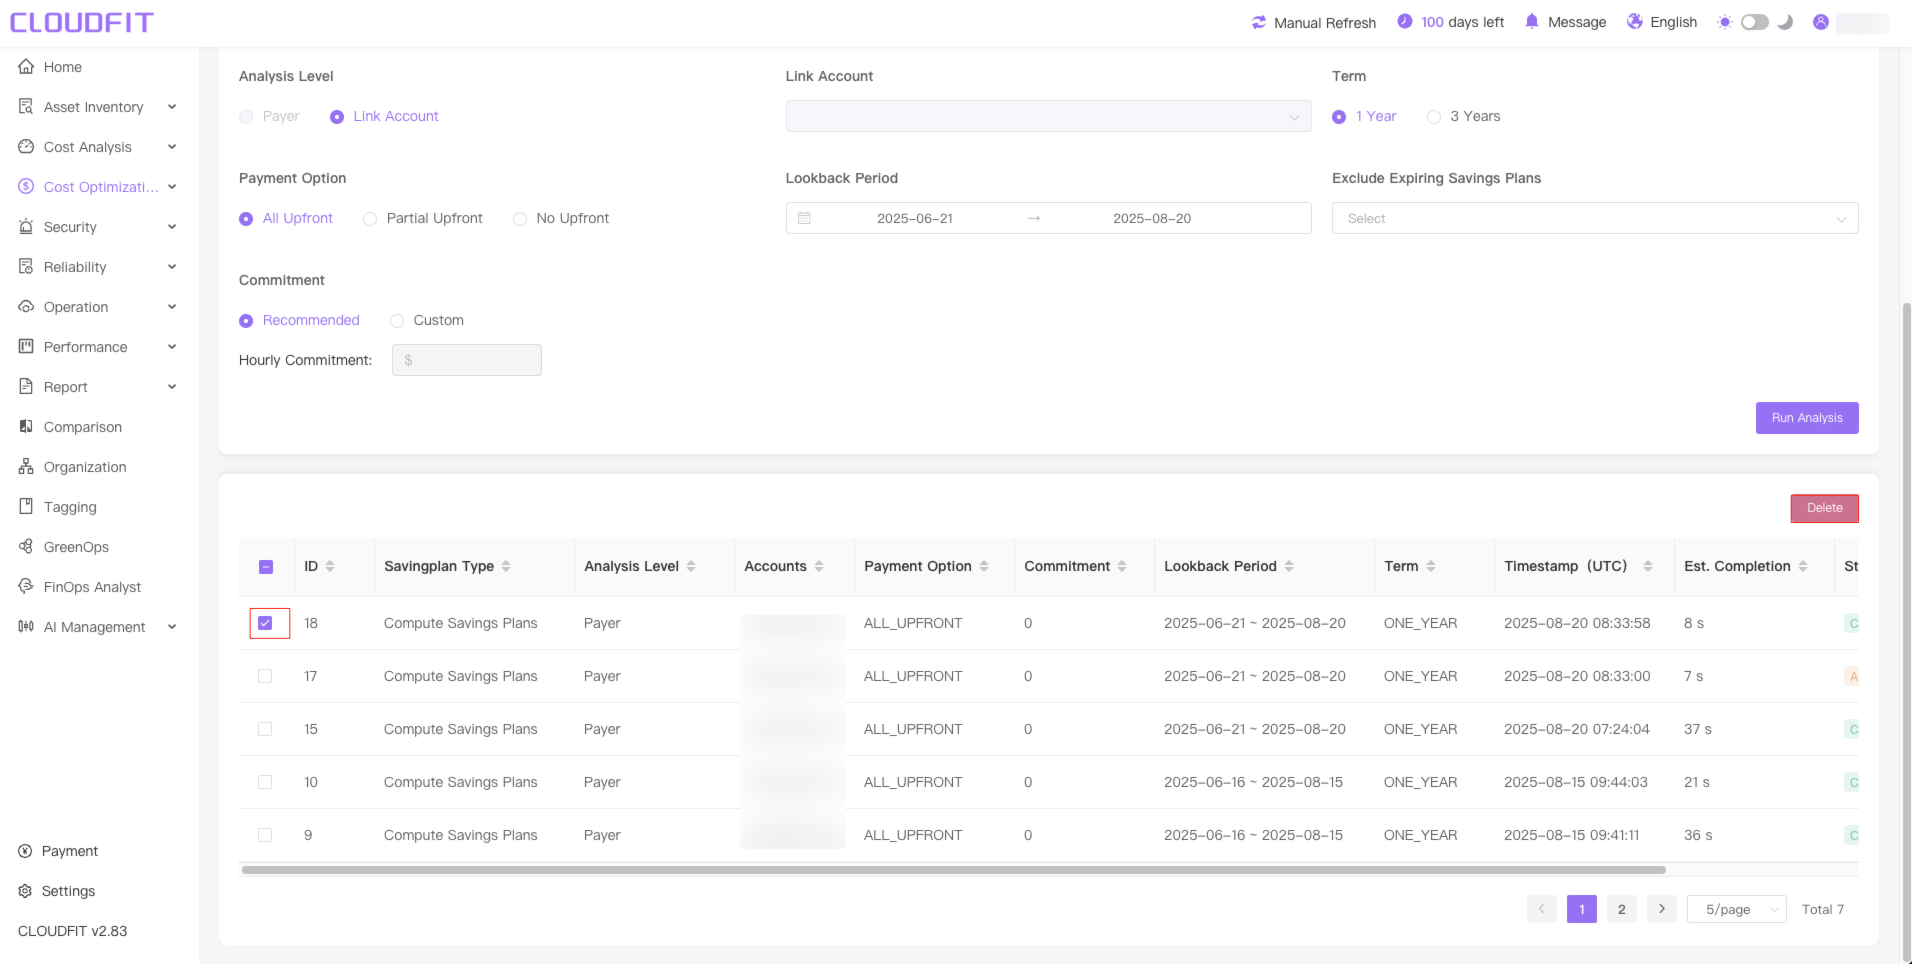
Delete
Select the corresponding checkbox and click the Delete button to delete the corresponding analysis item,as shown below:
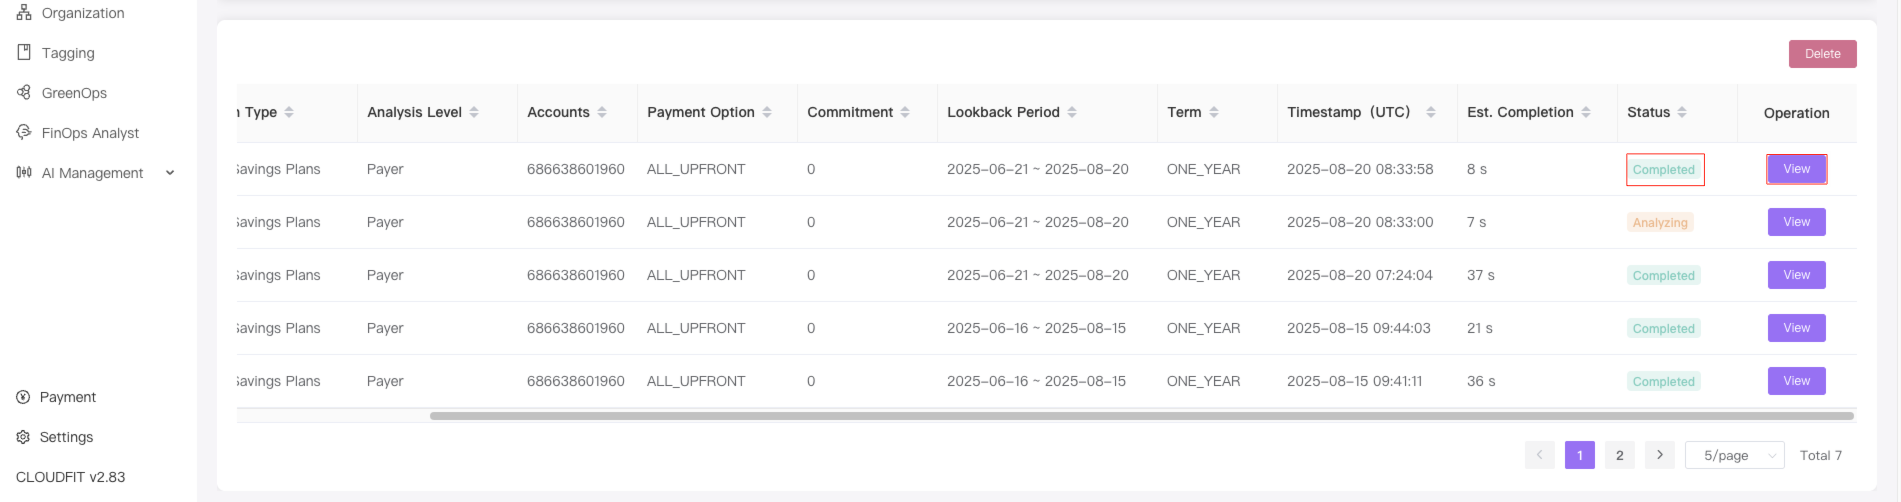
View
Move the slider to the far right to see the View button,as shown below:
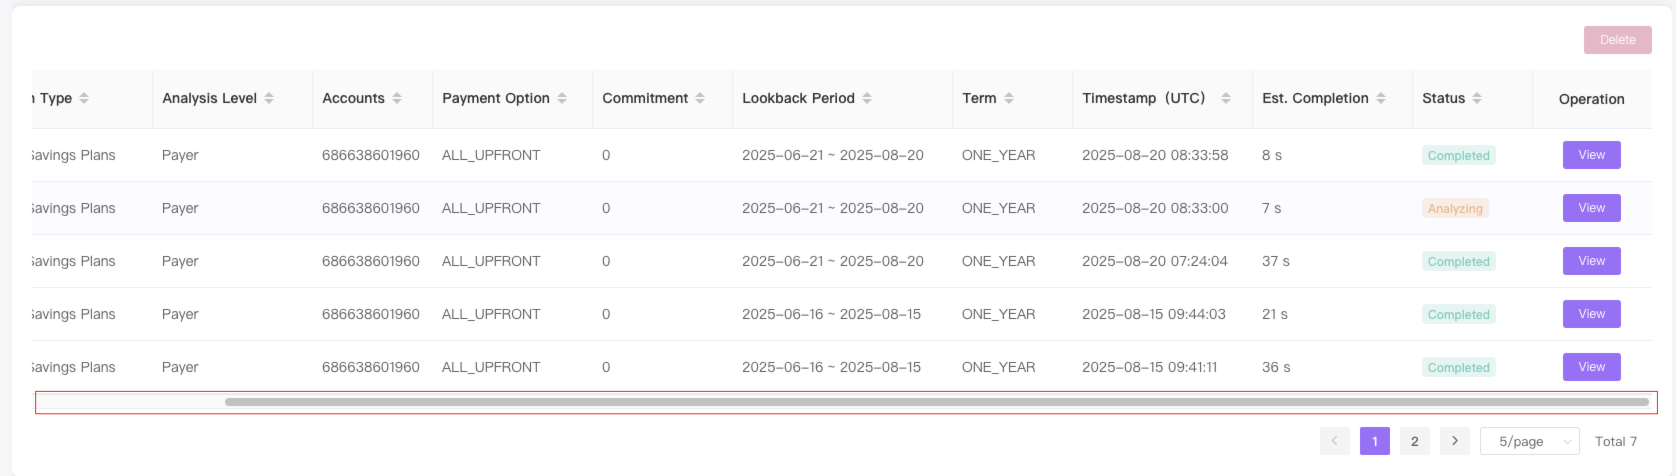
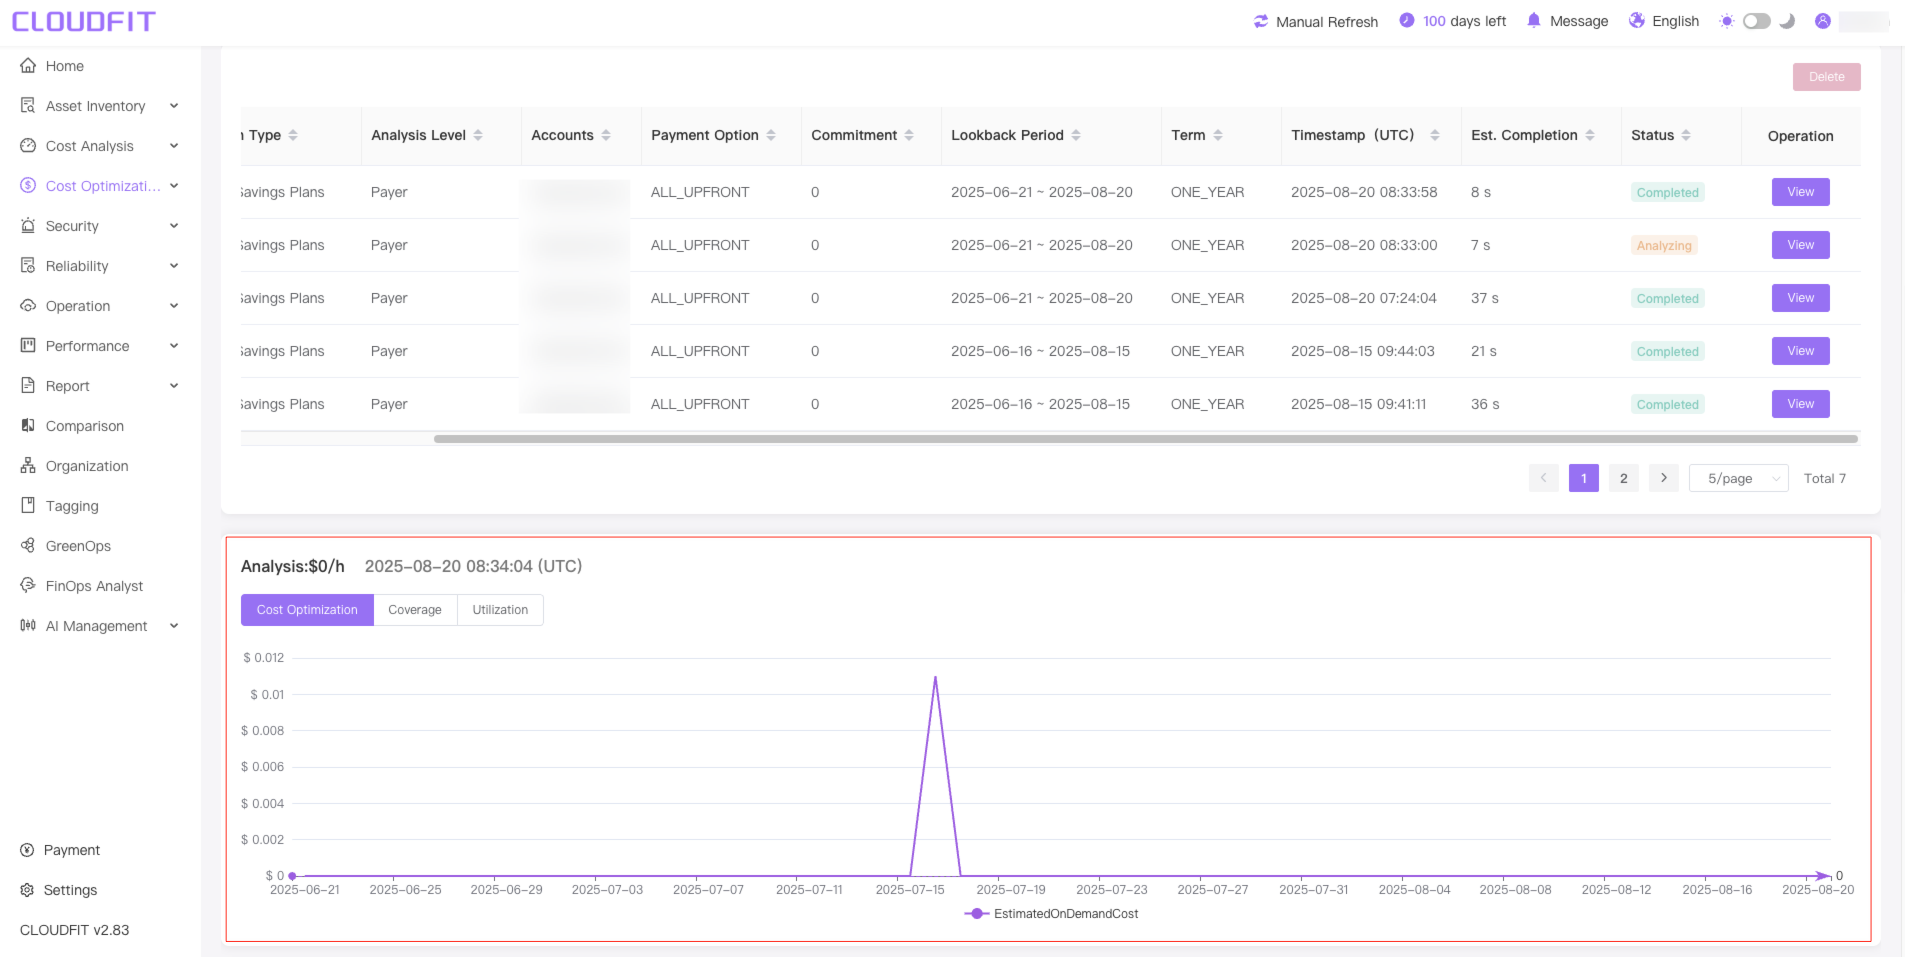
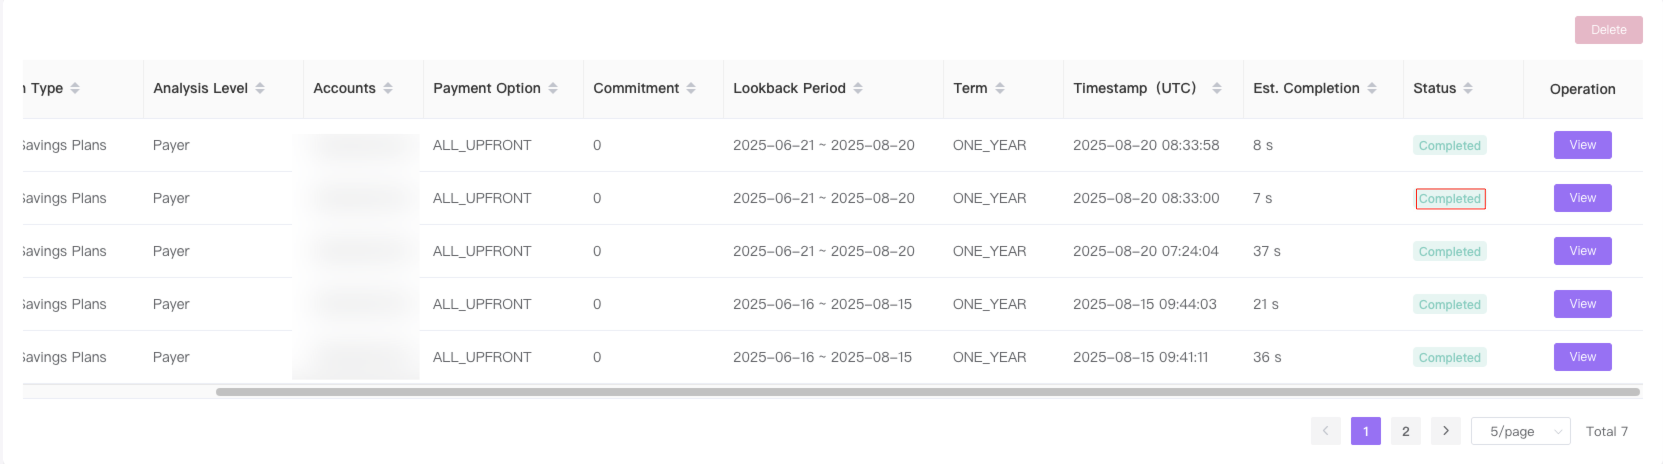
When the Status is Completed, click the View button and the analysis results will appear below,as shown below:
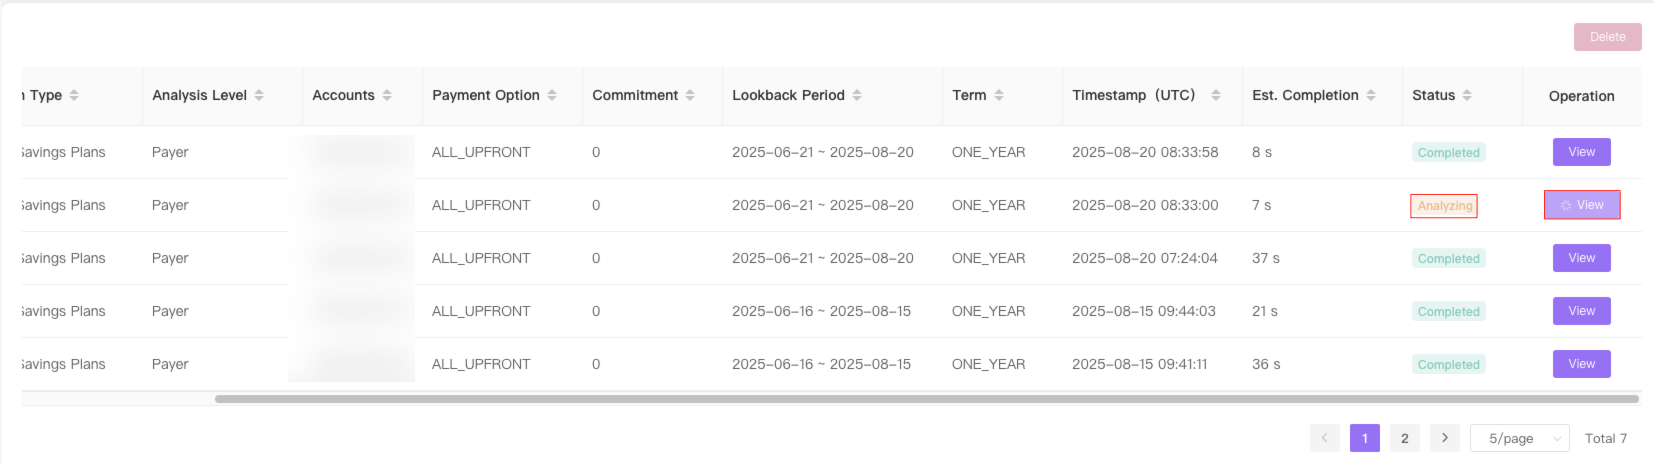
When the Status is Analyzing , click the View button and the analysis results will appear below,as shown below:
When the Status is Analyzing, clicking the View button will reanalyze,as shown below:
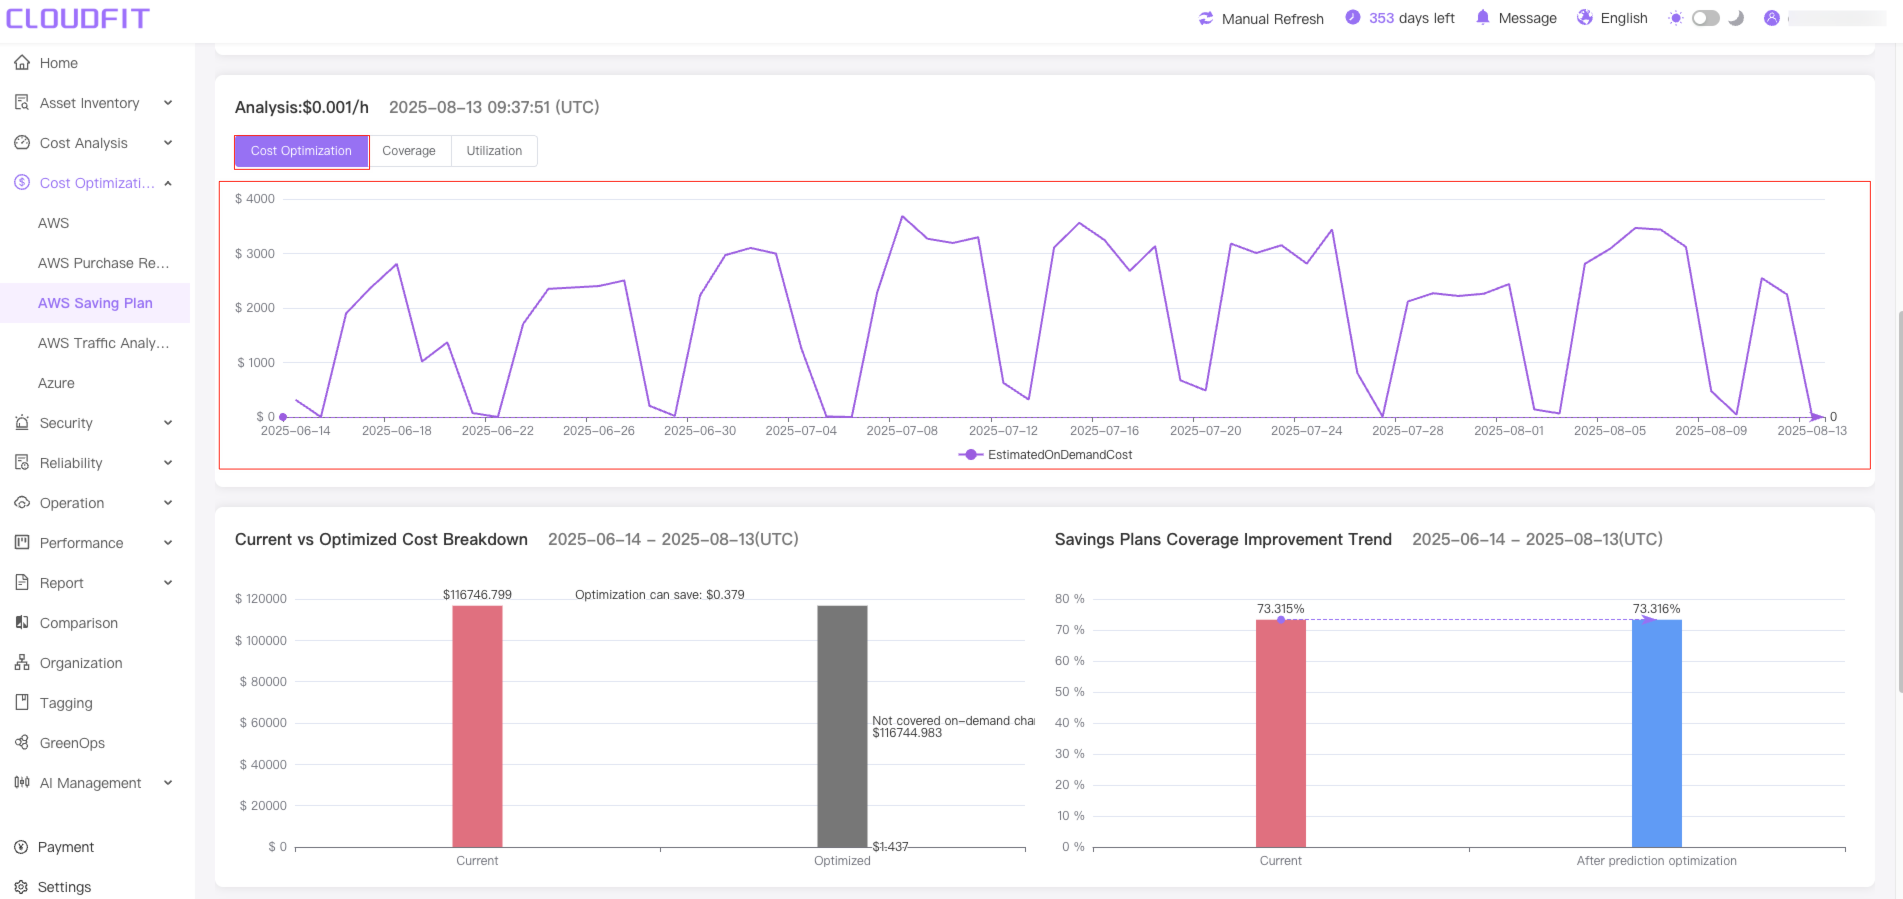
Analysis Results Display
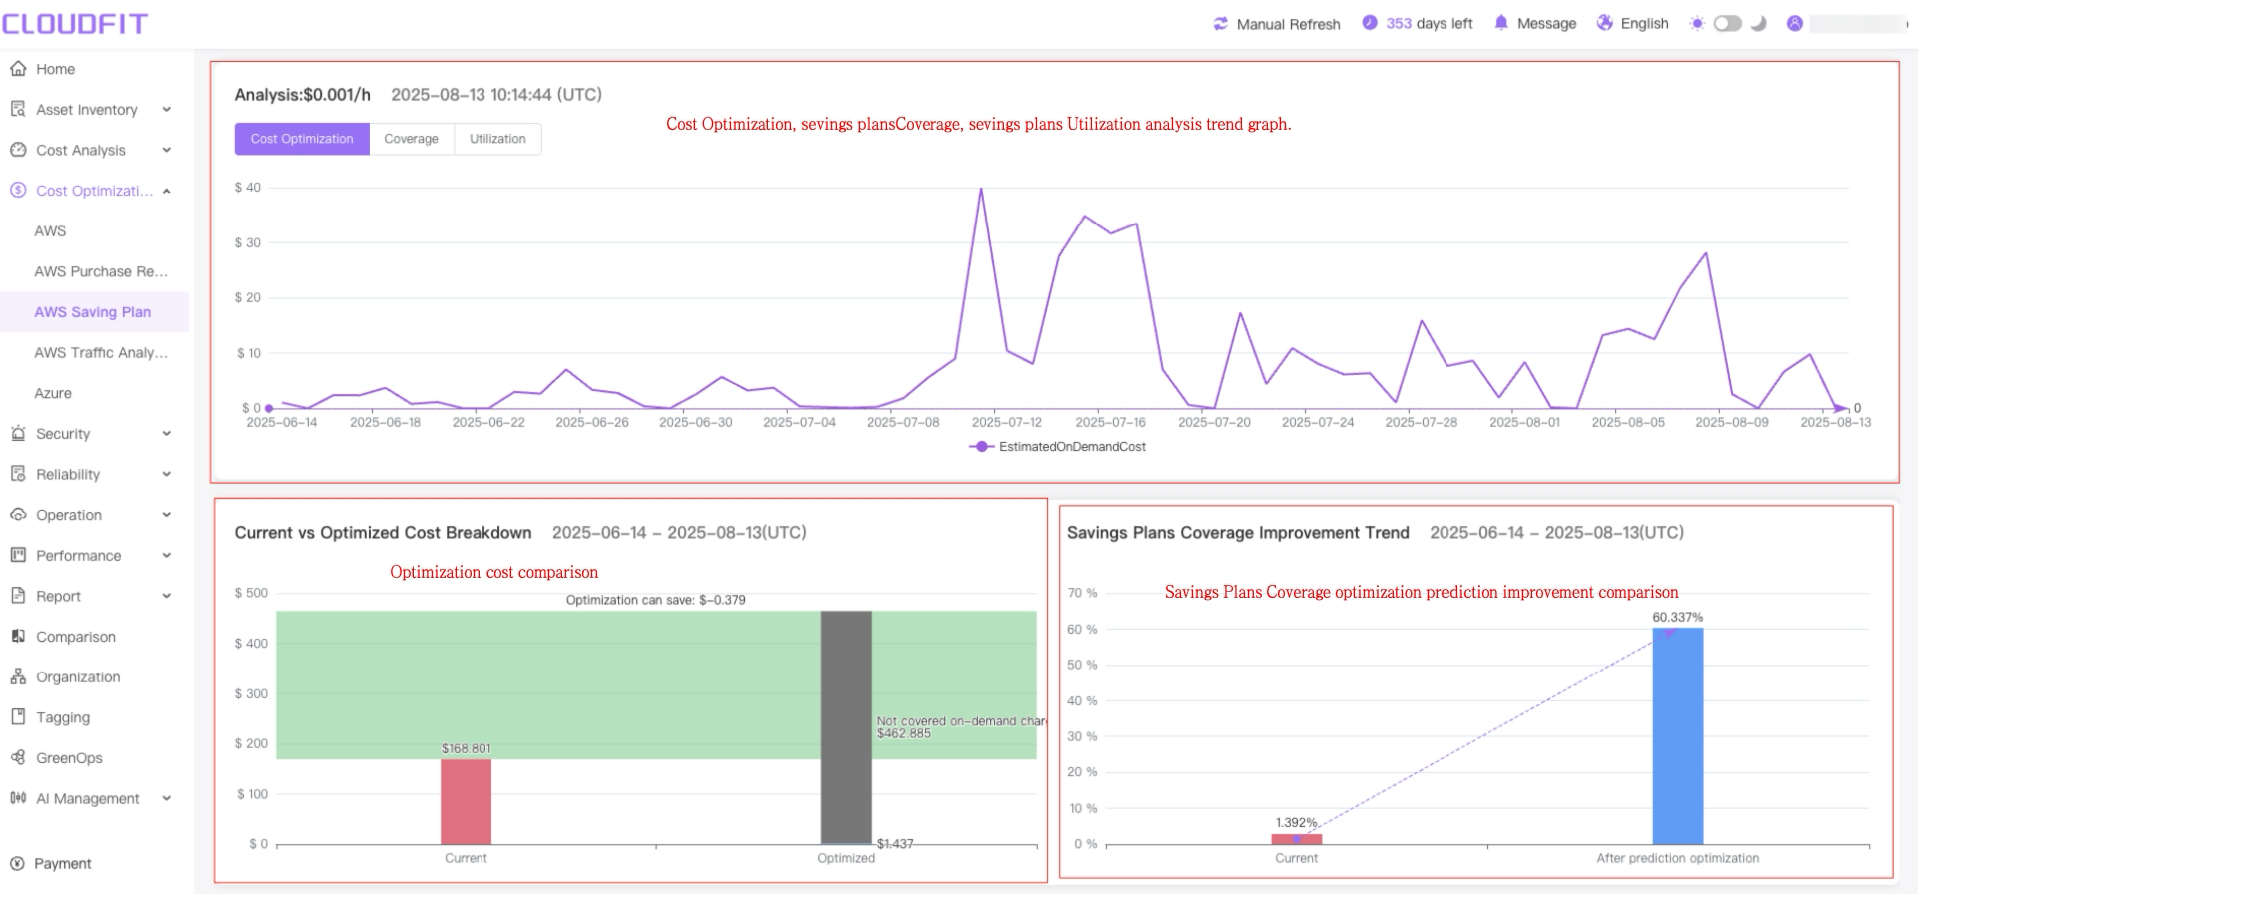
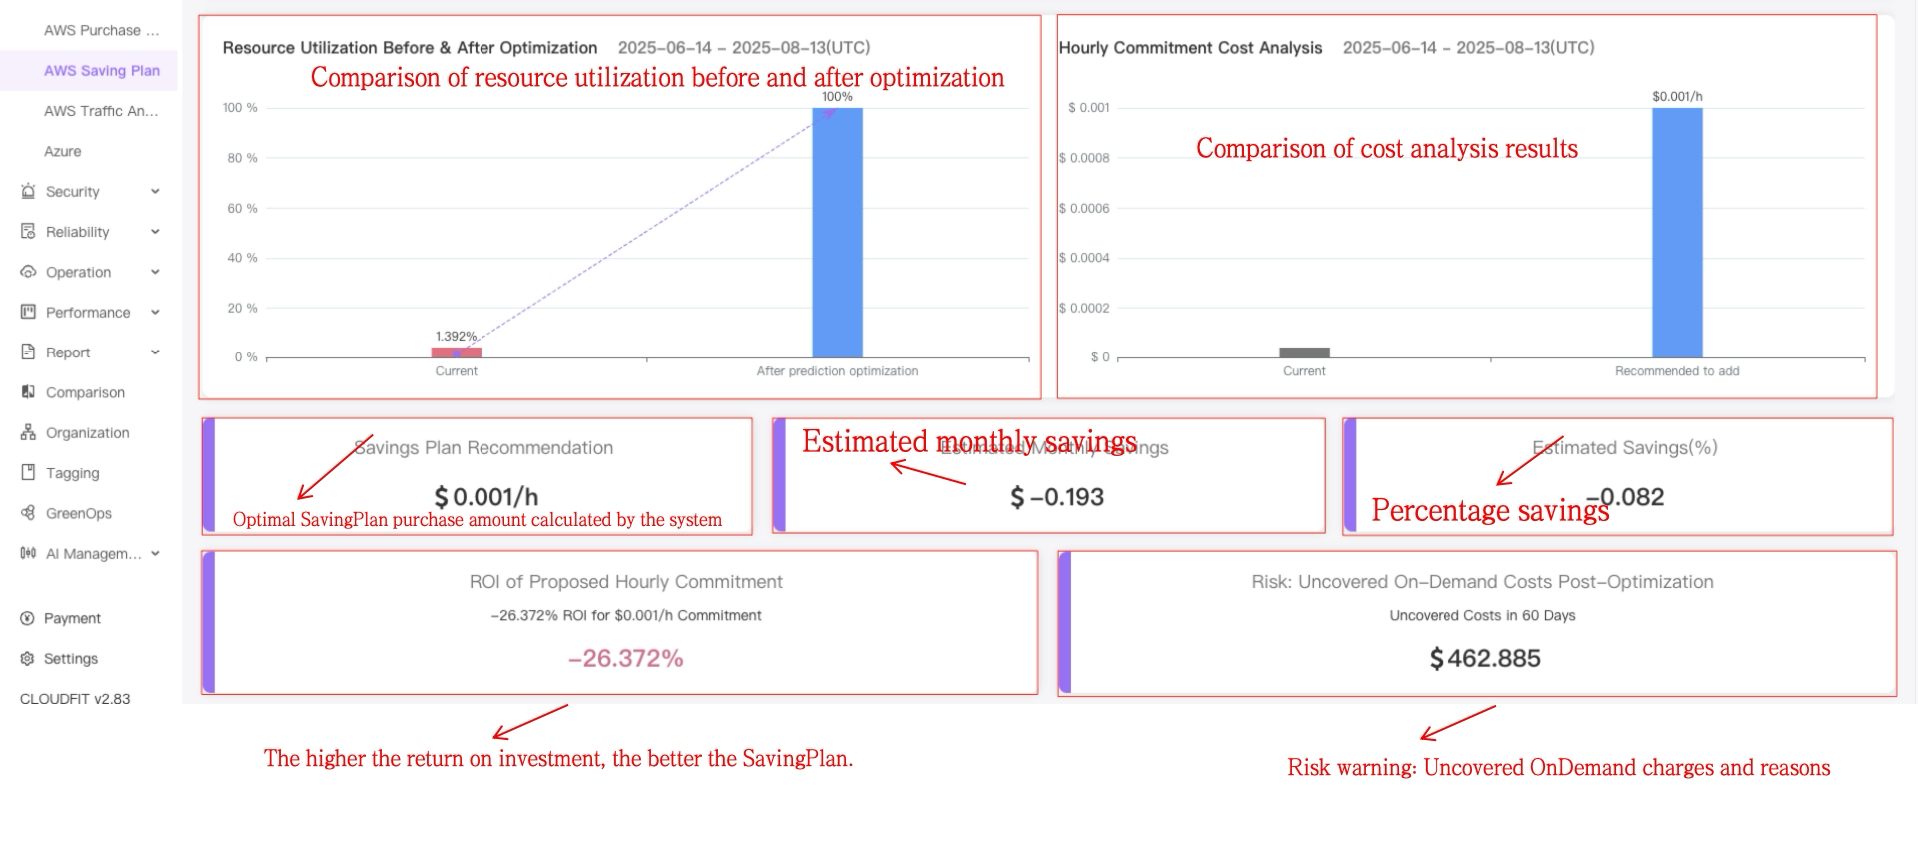
Cost optimization demonstration
Click the Cost Optimization button to view the current cost and optimized cost analysis results, as shown below:
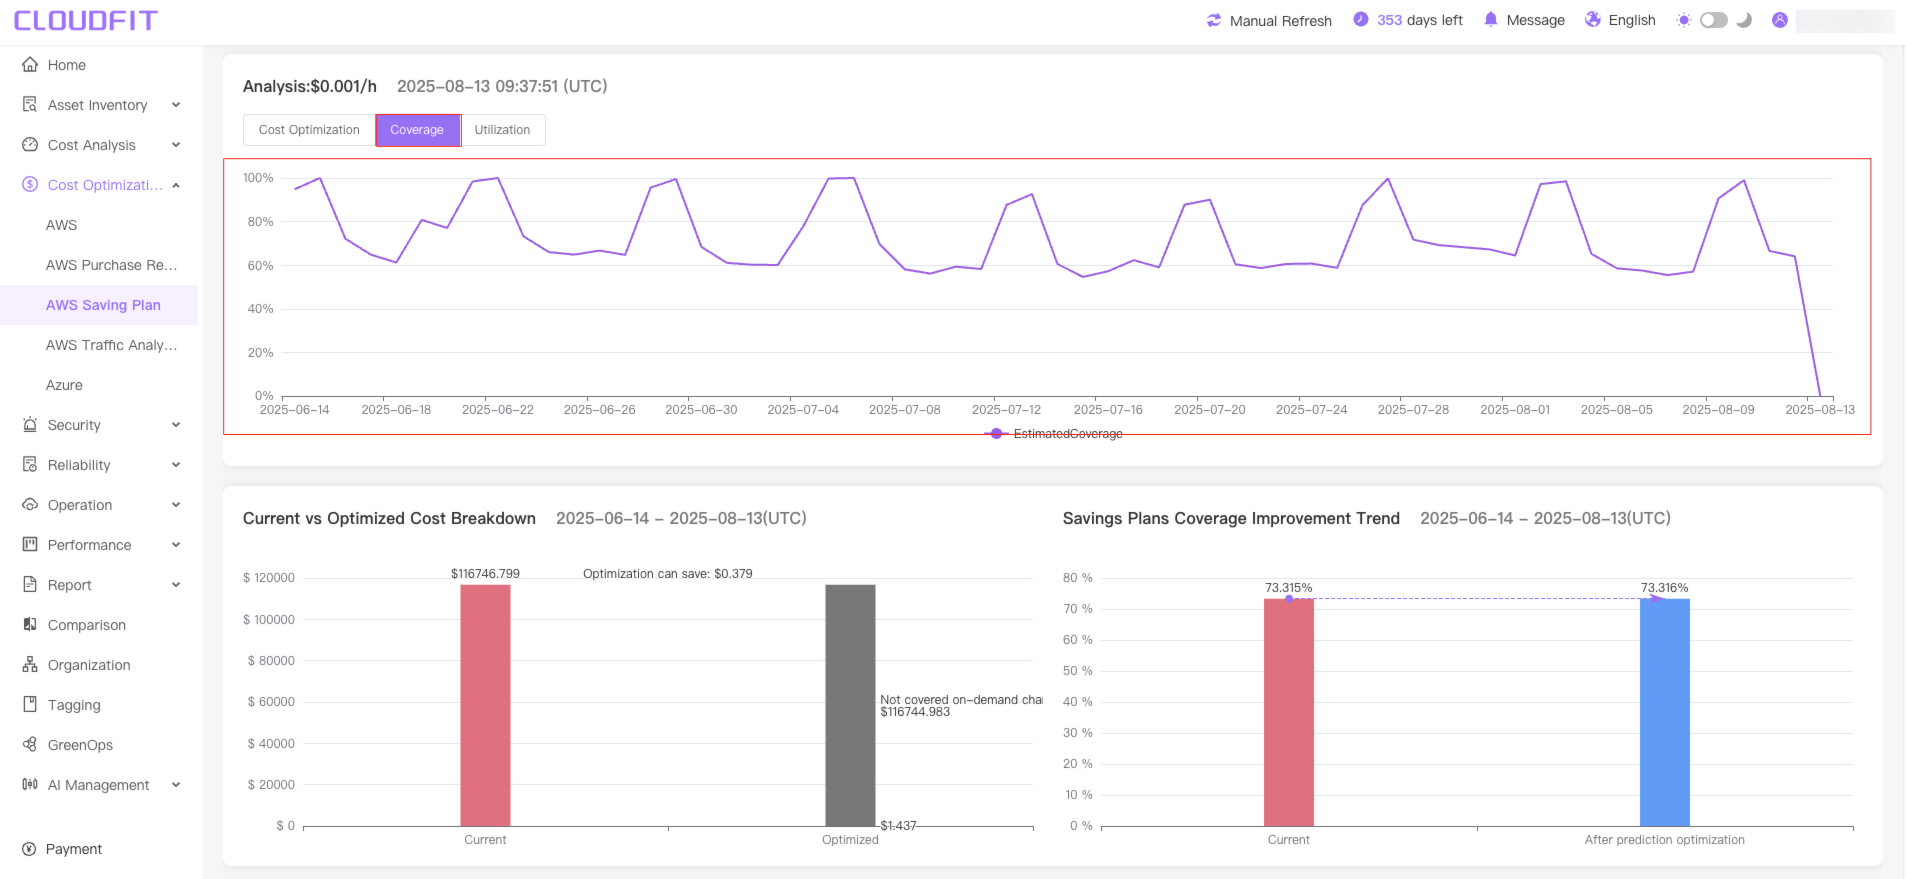
Coverage
Click the Coverage button, the system will automatically calculate the coverage rate of seving plan, as shown below:
Utilization
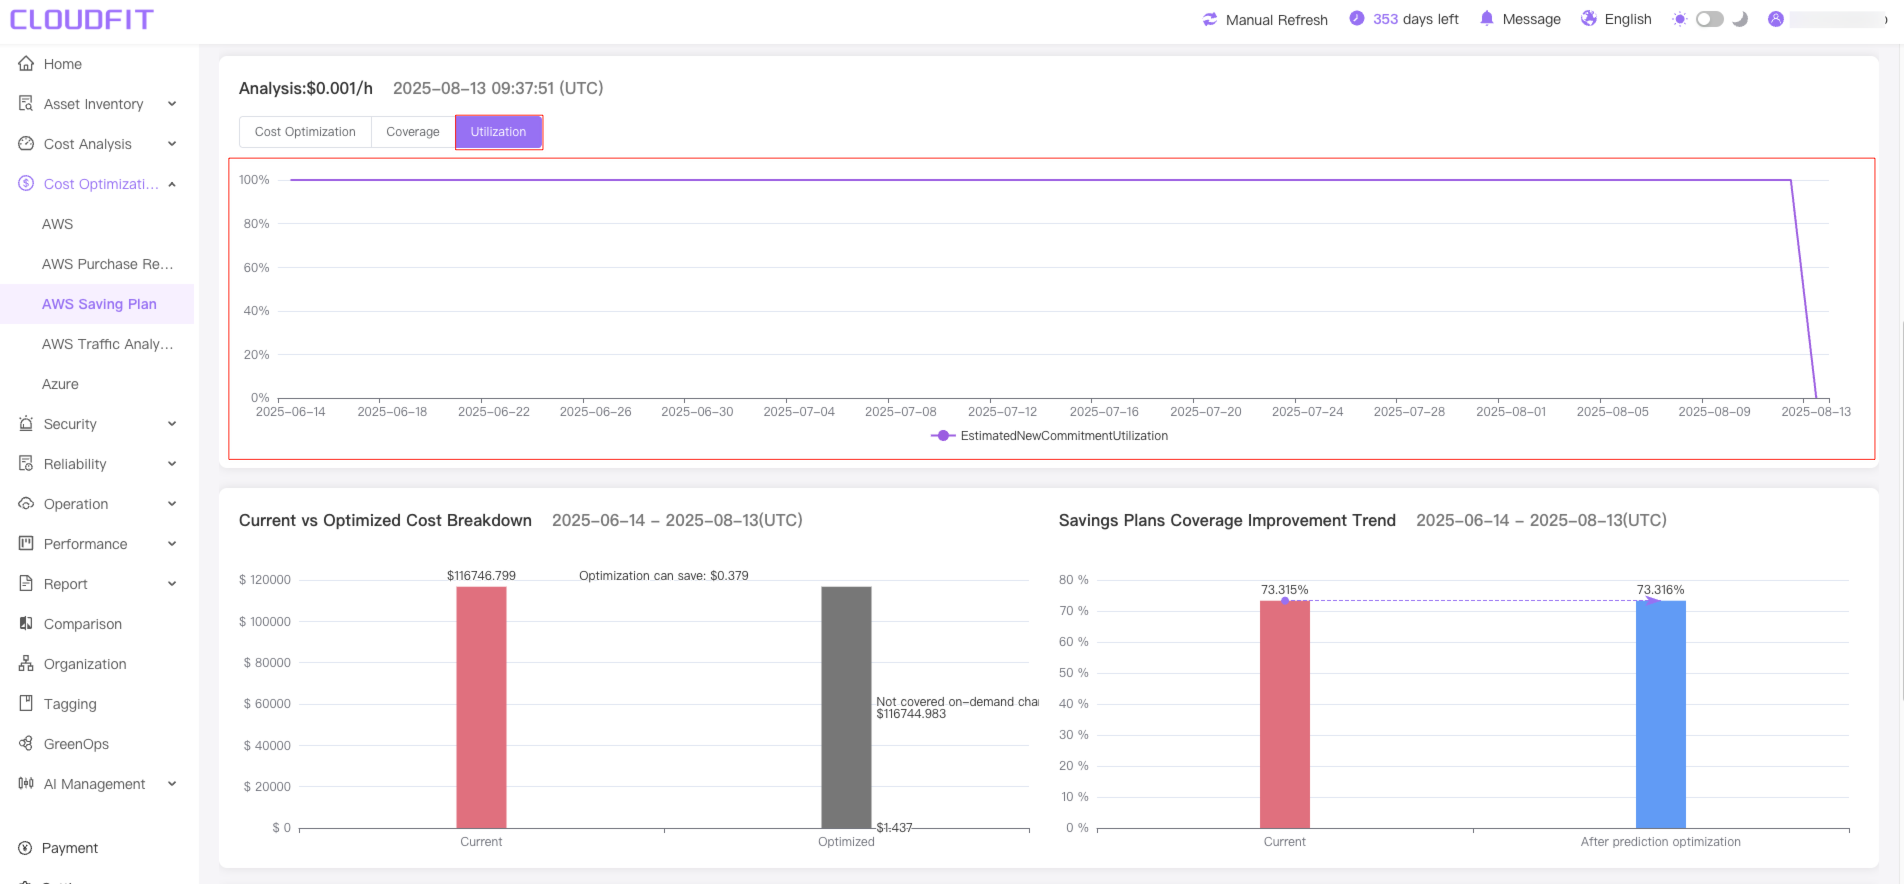
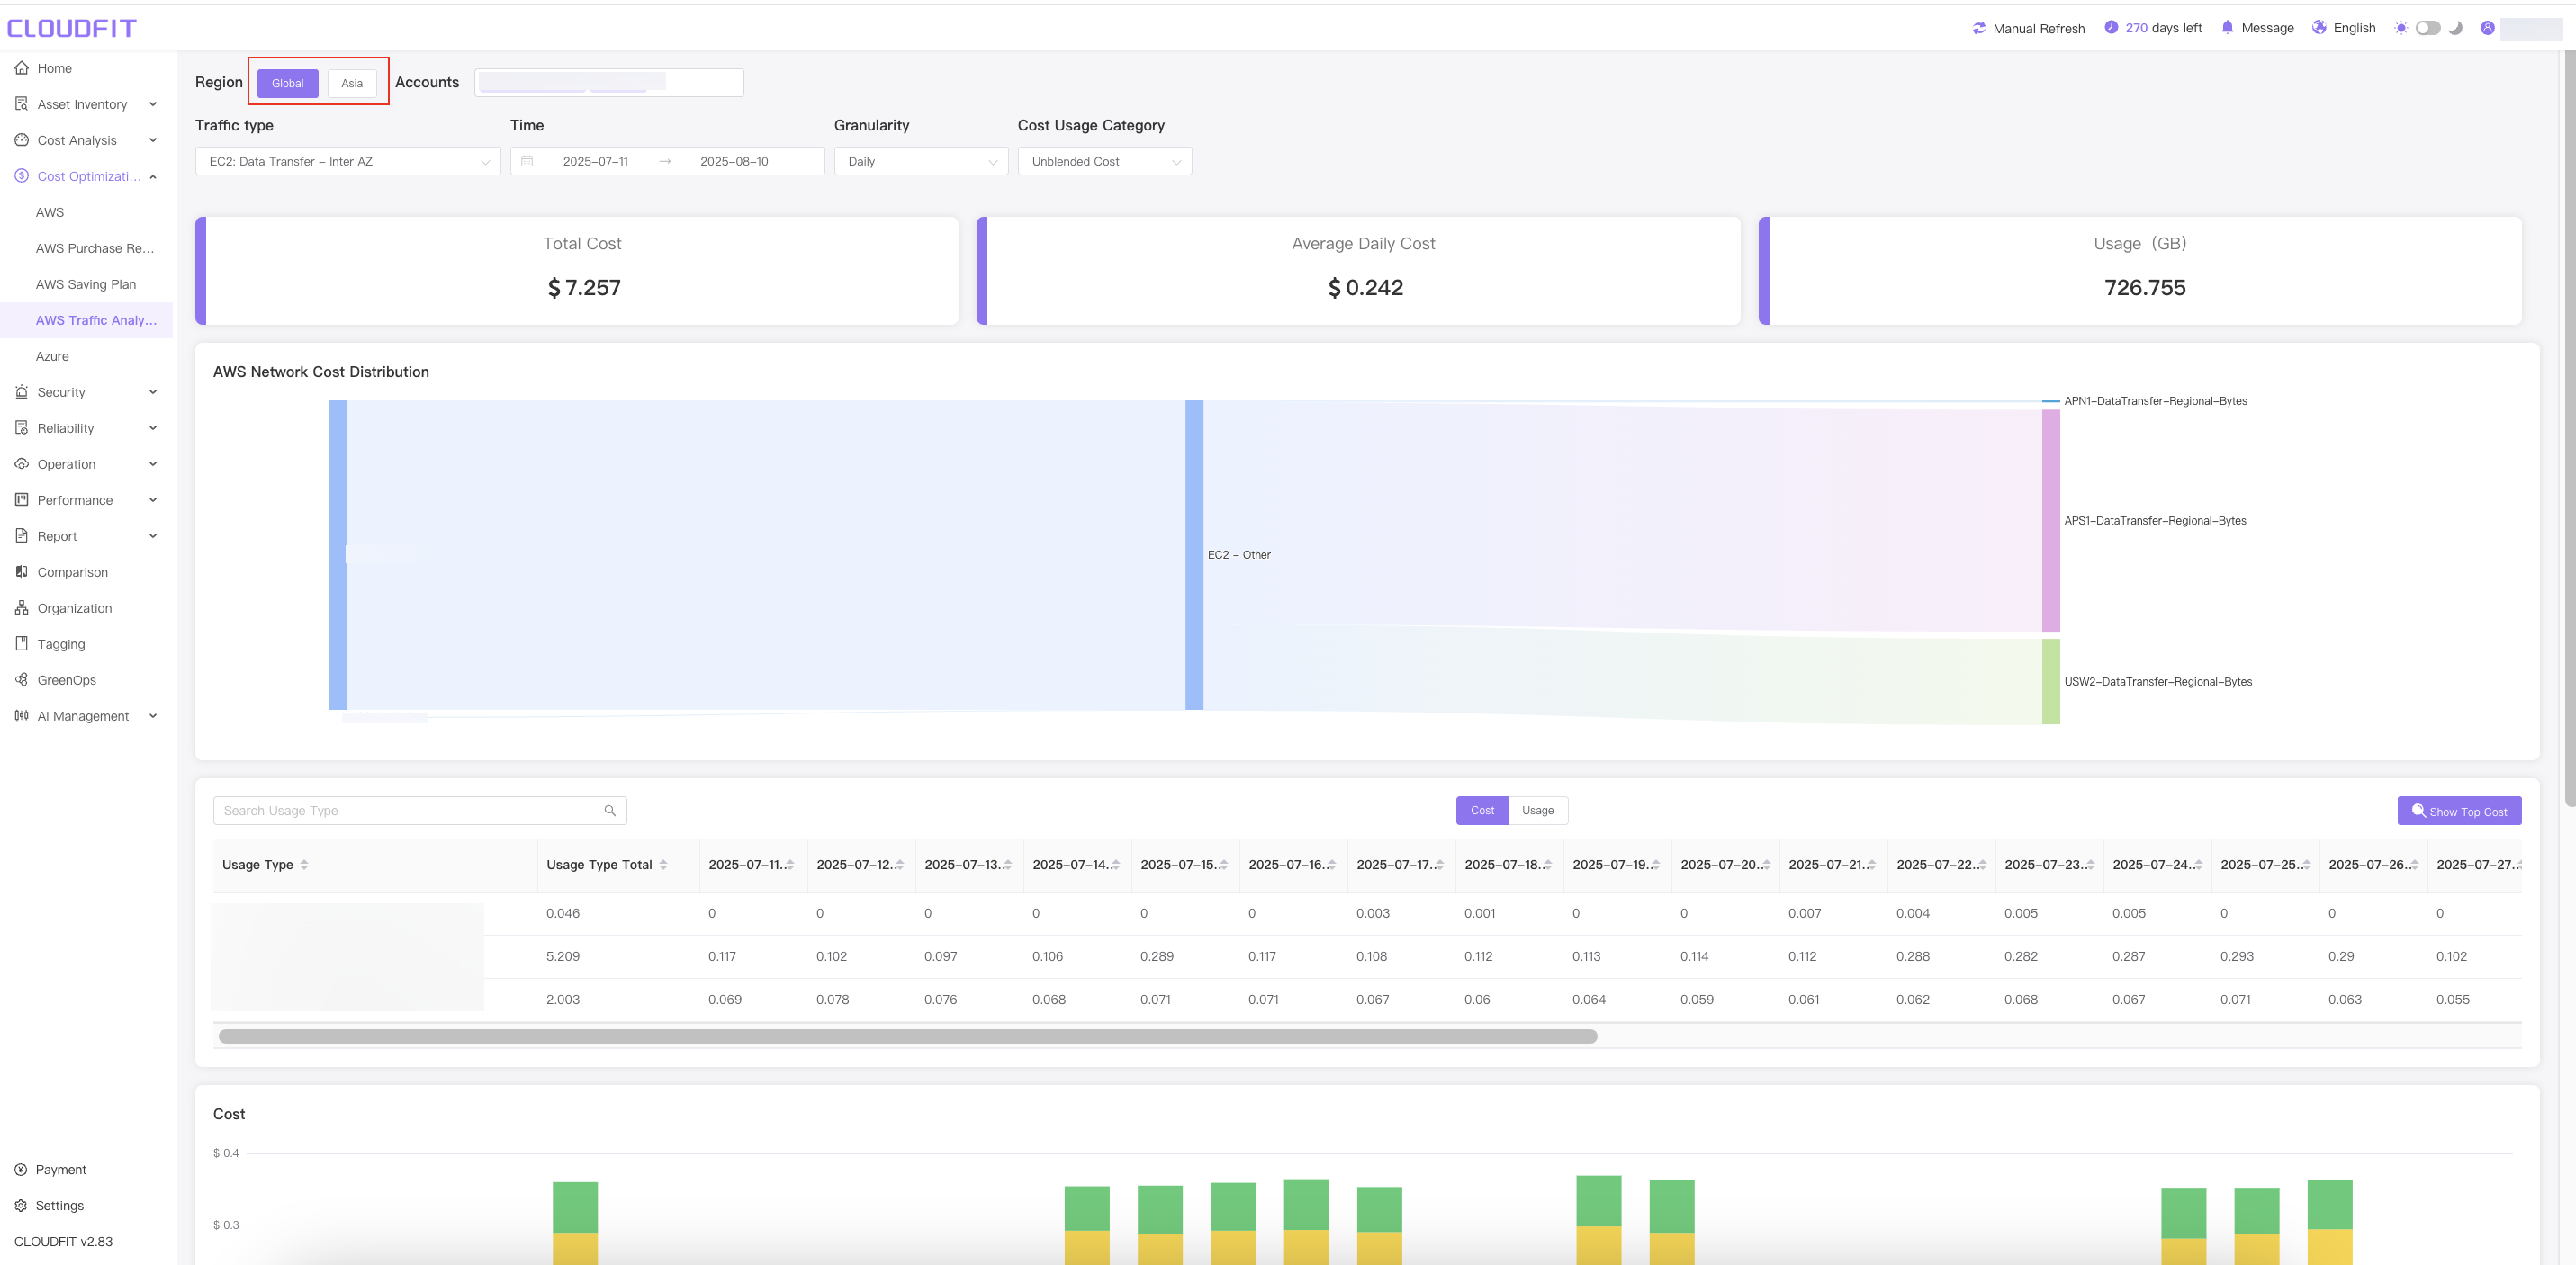
AWS Traffic Analyzer
Access the management console by selecting Cost Optimization -> AWS Traffic Analyzer from the left navigation bar, as shown below:
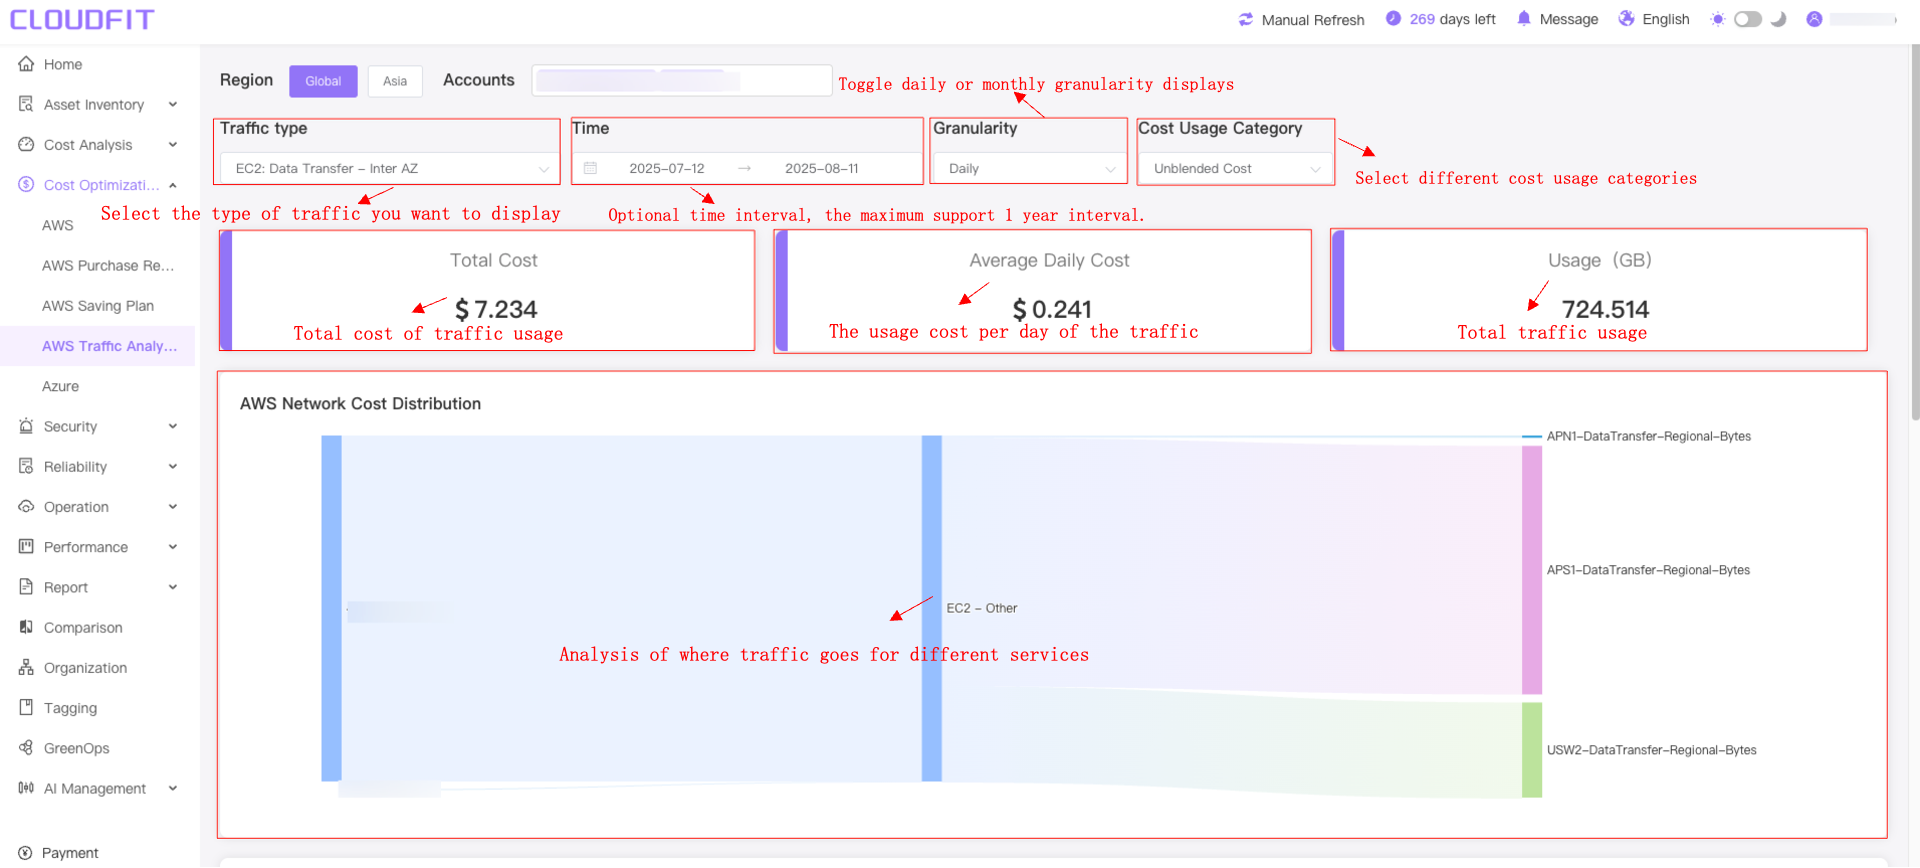
Region Filter
Click the Global/China button to switch between domestic and international View traffic usage details, as shown below:
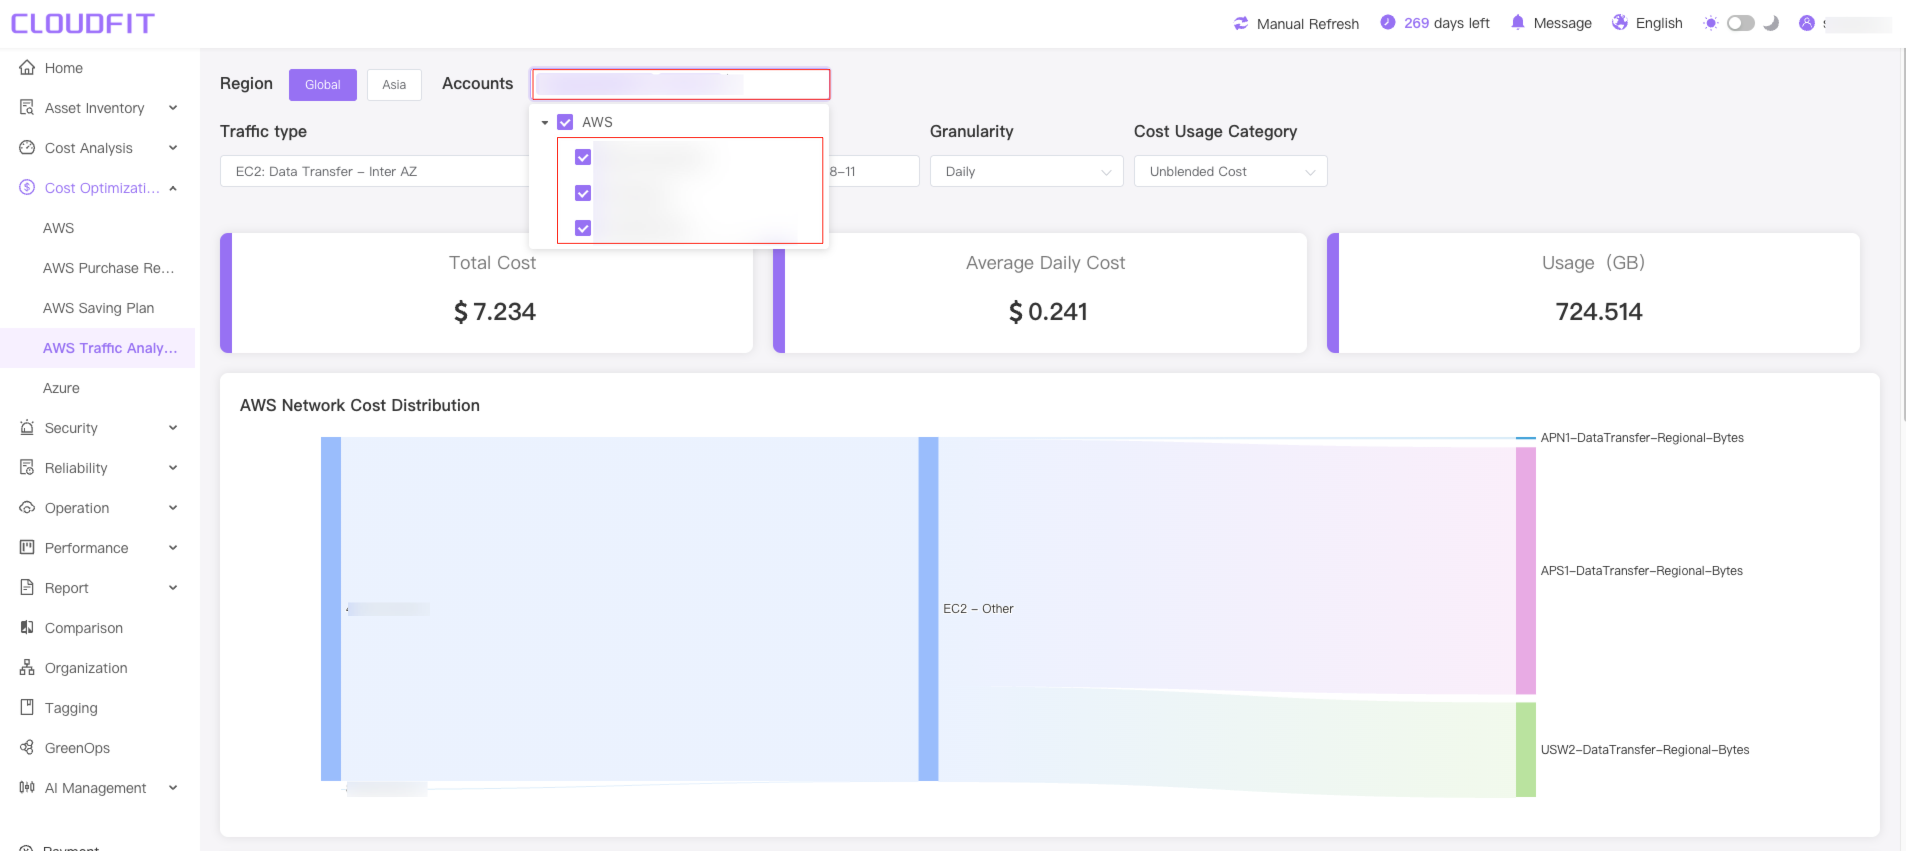
Account Filter
Click on the Account Filter Box to see traffic usage for one or more accounts, as shown below:
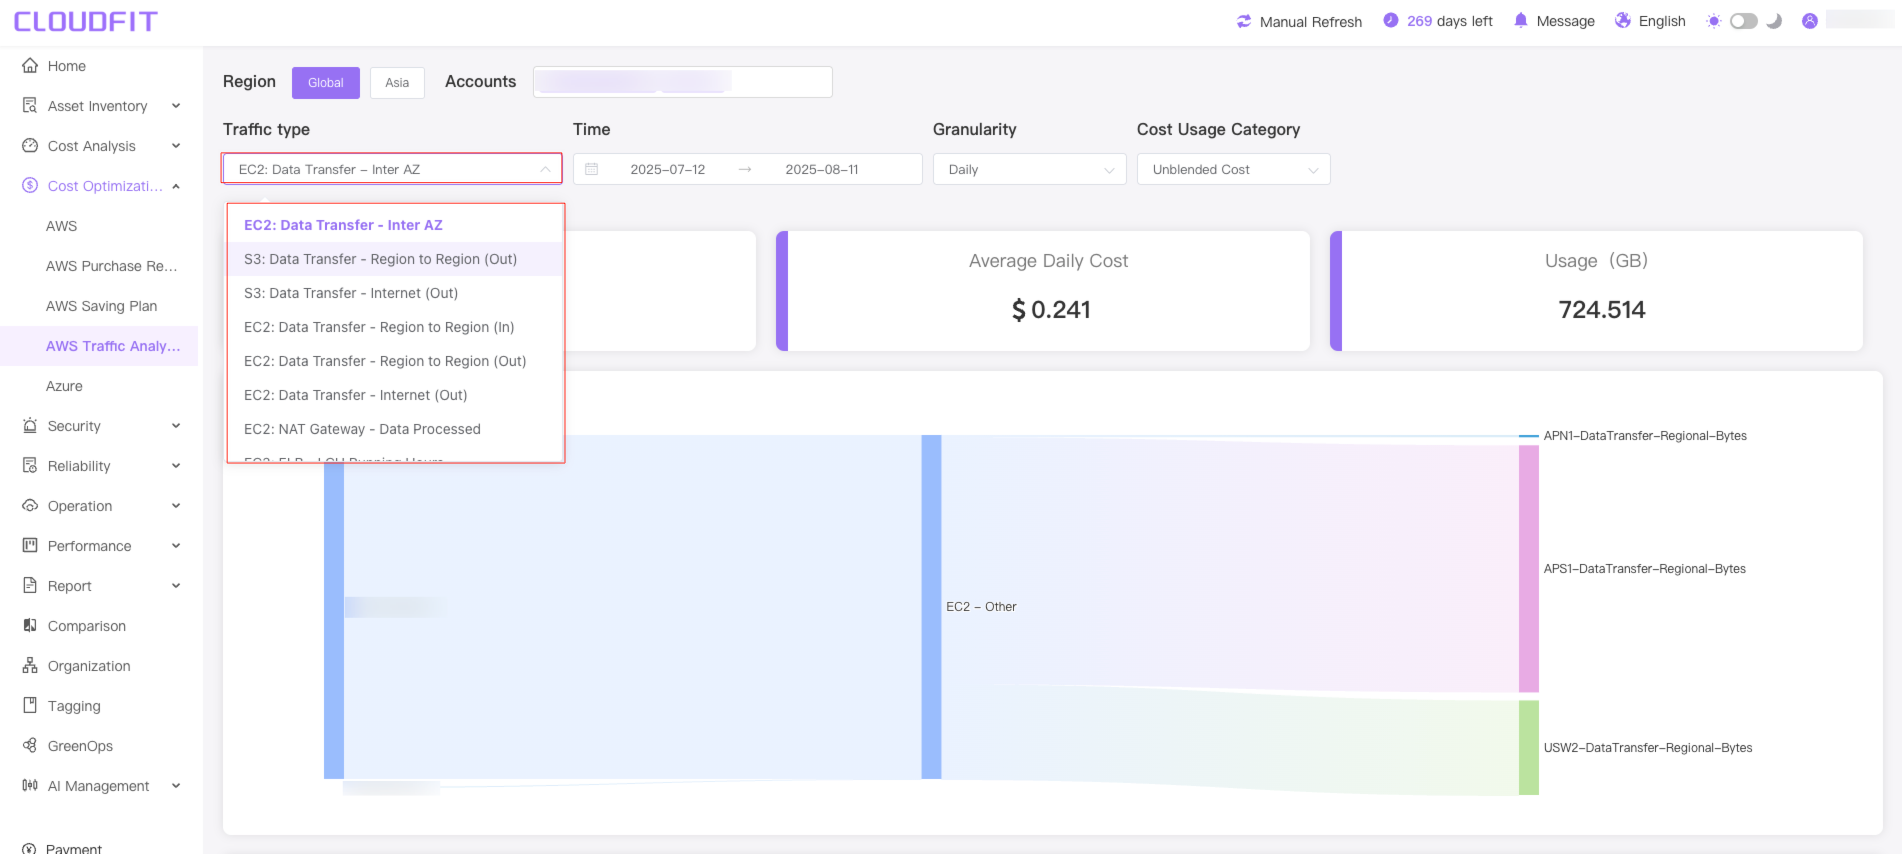
Traffic type filtering
Click the Traffic type selector to select different traffic types, as shown below:
AWS Traffic types explained
| Service | Traffic Type | Description | Typical Use Case |
|---|---|---|---|
| EC2 | Data Transfer - Inter AZ | Data transfer between EC2 instances across Availability Zones (bidirectional) | High-availability architectures |
| Data Transfer - Region to Region (In) | Inbound data from another AWS Region to EC2 | Cross-region data processing | |
| Data Transfer - Region to Region (Out) | Outbound data from EC2 to another AWS Region | Data replication/backup | |
| Data Transfer - Internet (Out) | Outbound data from EC2 to public internet | User access/API responses | |
| NAT Gateway - Data Processed | All traffic processed by NAT Gateway | Private subnet internet access | |
| ELB - LCU Running Hours | Load Balancer Capacity Unit usage | Application load balancing | |
| Data Transfer - CloudFront (Out) | Data from EC2 to CloudFront edge nodes | Dynamic content acceleration | |
| S3 | Data Transfer - Region to Region (Out) | Outbound data from S3 to another Region | Cross-region replication |
| Data Transfer - Internet (Out) | Outbound data from S3 to public internet | File downloads | |
| RDS | Data Transfer - Region to Region - Out | Outbound data from RDS to another Region | Read replica synchronization |
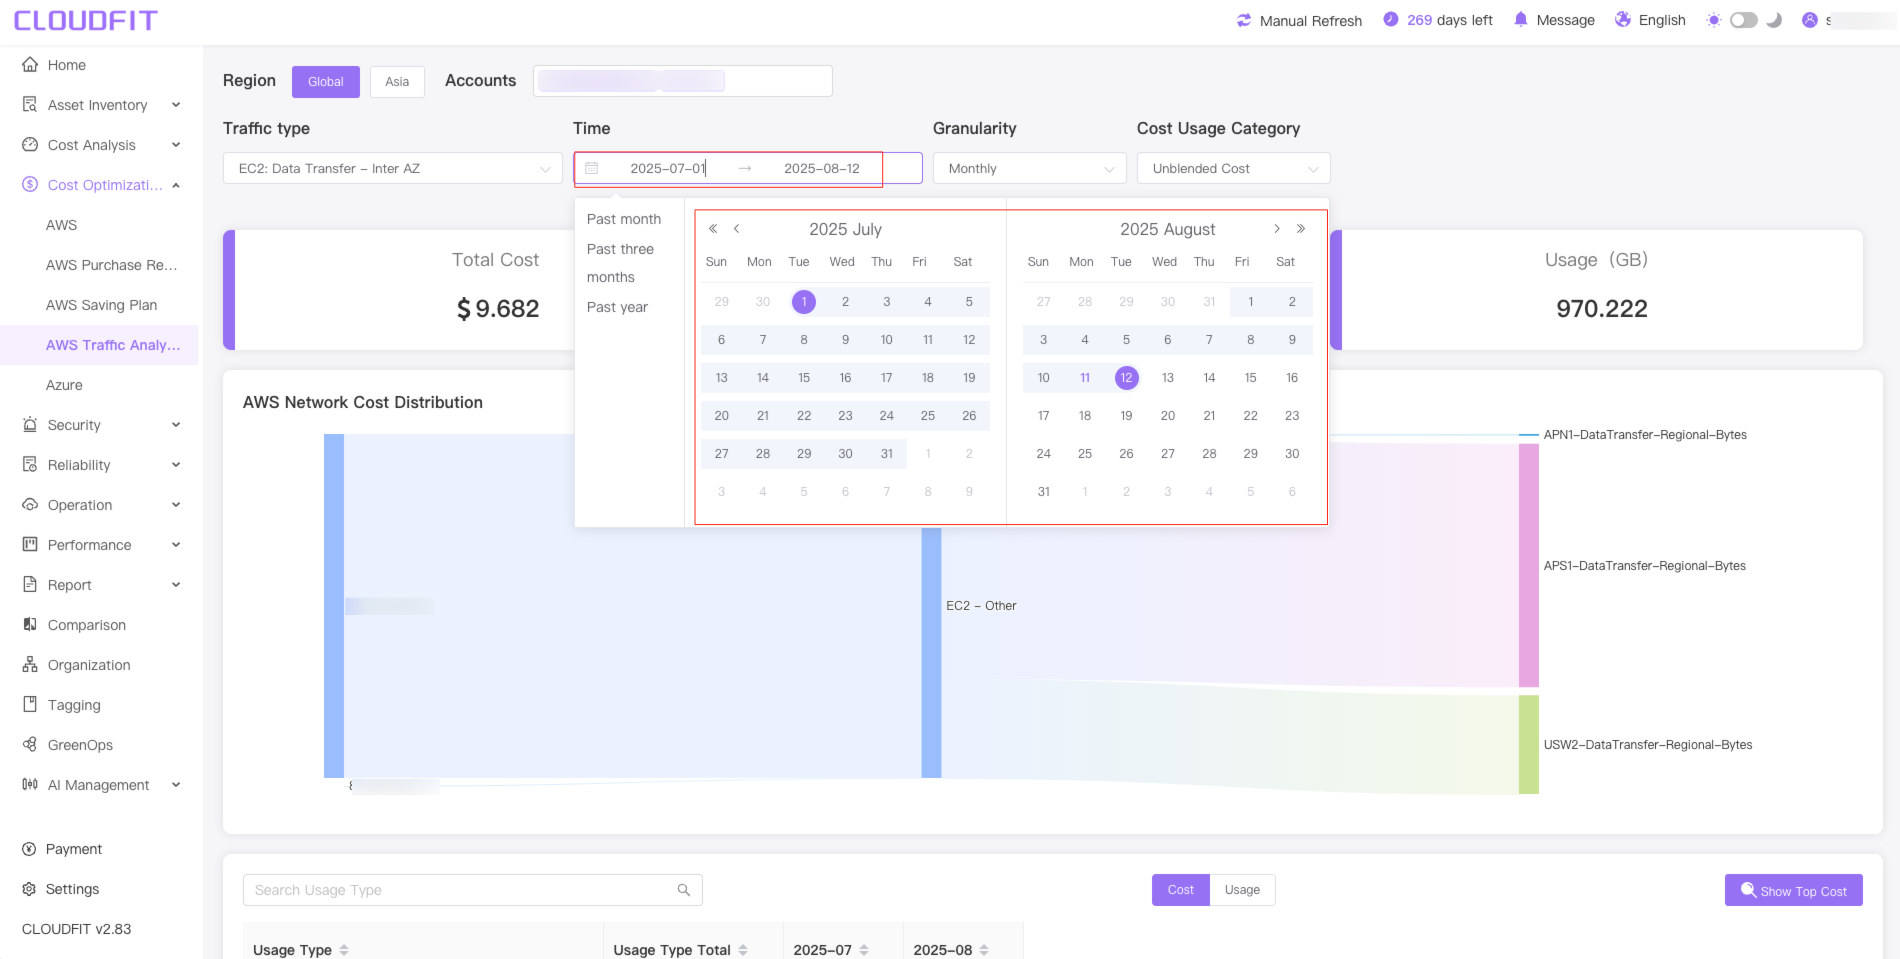
Date range selection
You can query data usage fees and usage for any time period, up to one year, as shown below:
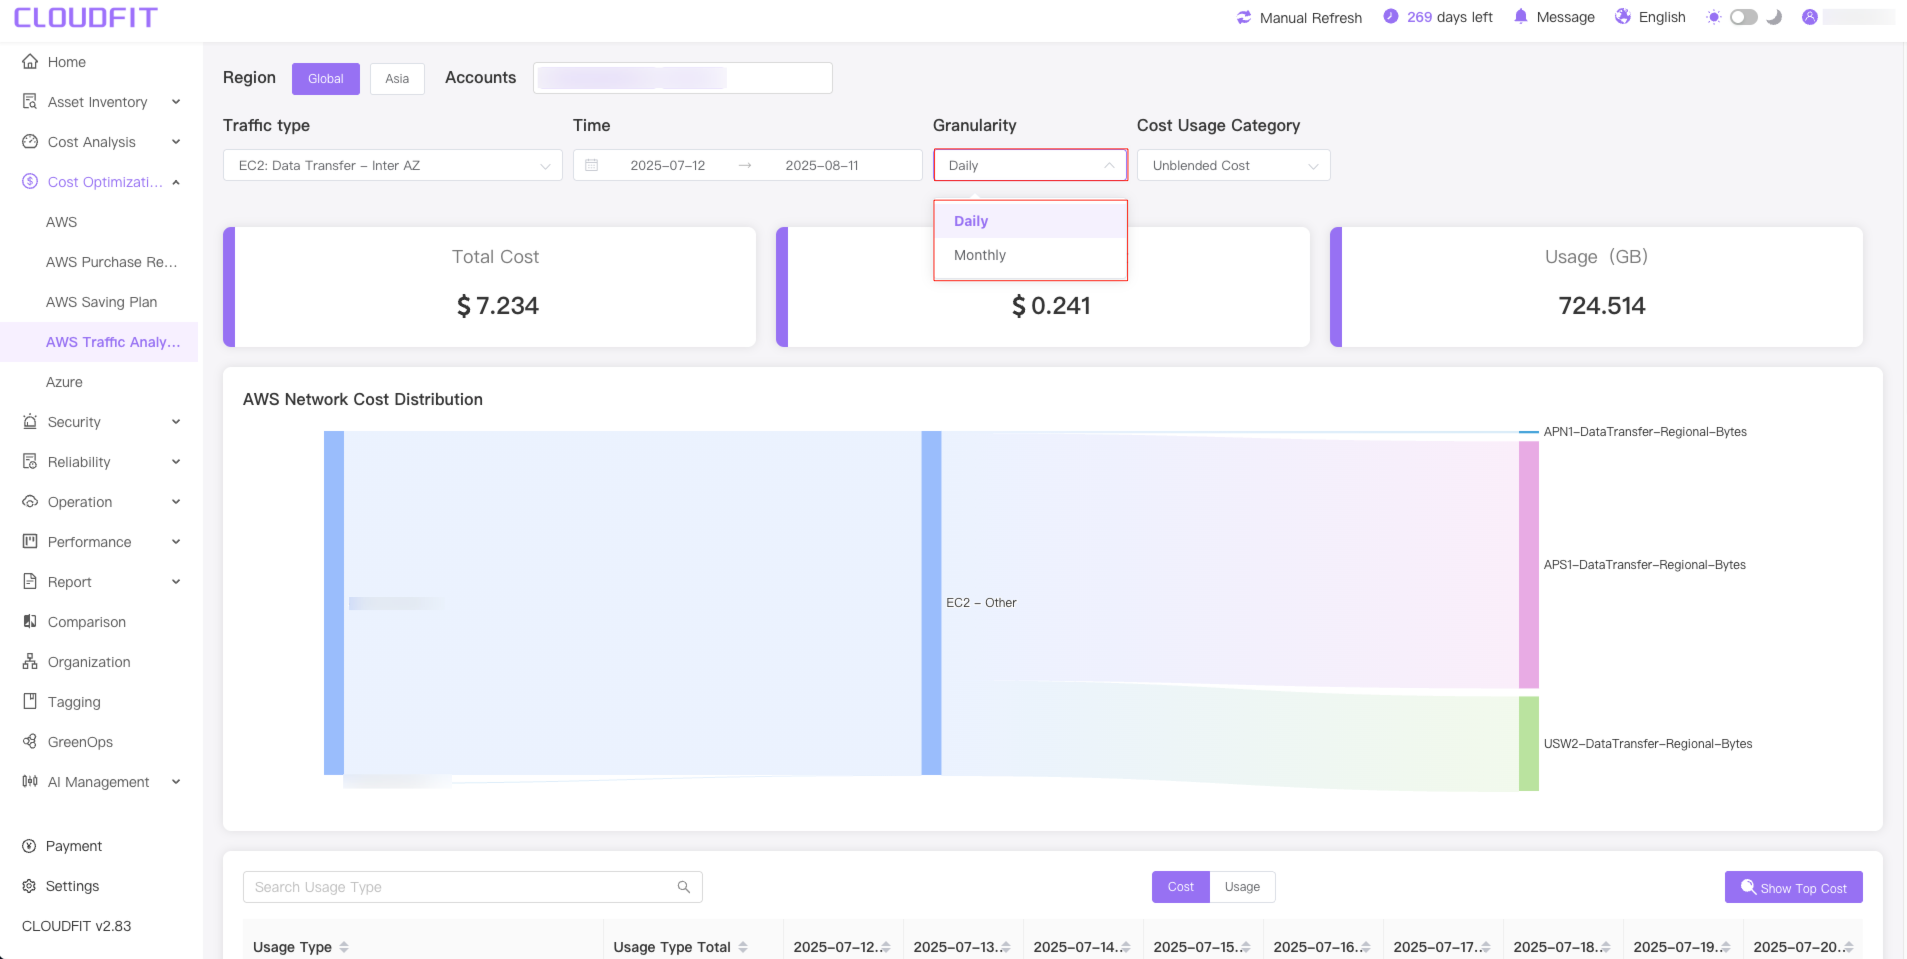
Granularity
Click on the Granularity filter box to display data usage at different times, as shown below:
Cost Usage Category
Click the Cost Usage Category filter box, to select the cost category you want to display,as shown below:
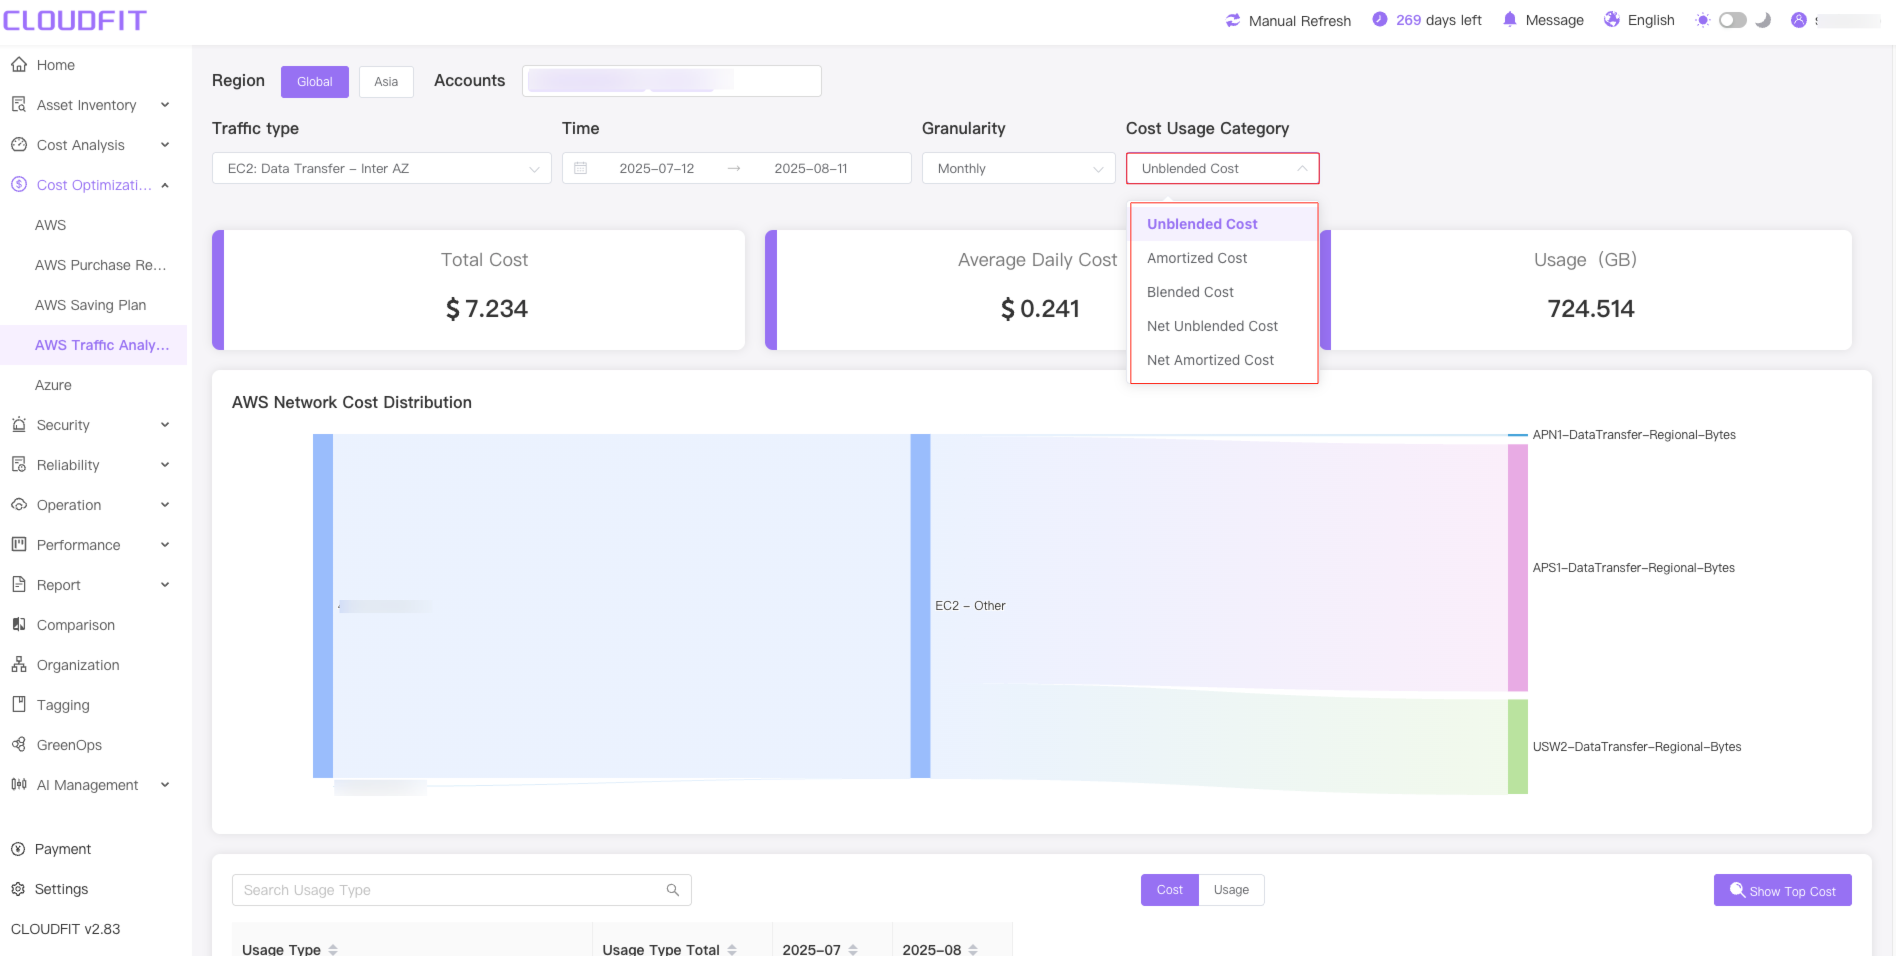
Cost Usage Category explained
| Cost Type | Description | When to Use |
|---|---|---|
| Unblended Cost | The raw cost of AWS services at the end of the billing period, before applying any discounts, reservations, or Savings Plans. | Best for analyzing actual usage costs before any optimizations. |
| Amortized Cost | The cost of Reserved Instances (RIs) or Savings Plans spread evenly over their term (e.g., monthly for a 1-year RI). | Useful for tracking long-term commitments and budget forecasting. |
| Blended Cost | The average cost combining On-Demand and Reserved Instance pricing. Shows the "effective" rate across all usage. | Used in enterprise billing to see overall cost efficiency. |
| Net Unblended Cost | Unblended cost after applying discounts (e.g., volume discounts, AWS Enterprise Discount Program). | Reflects the actual payable amount after negotiated discounts. |
| Net Amortized Cost | Amortized cost after applying discounts (e.g., RI discounts + additional savings). | Best for long-term cost optimization analysis. |
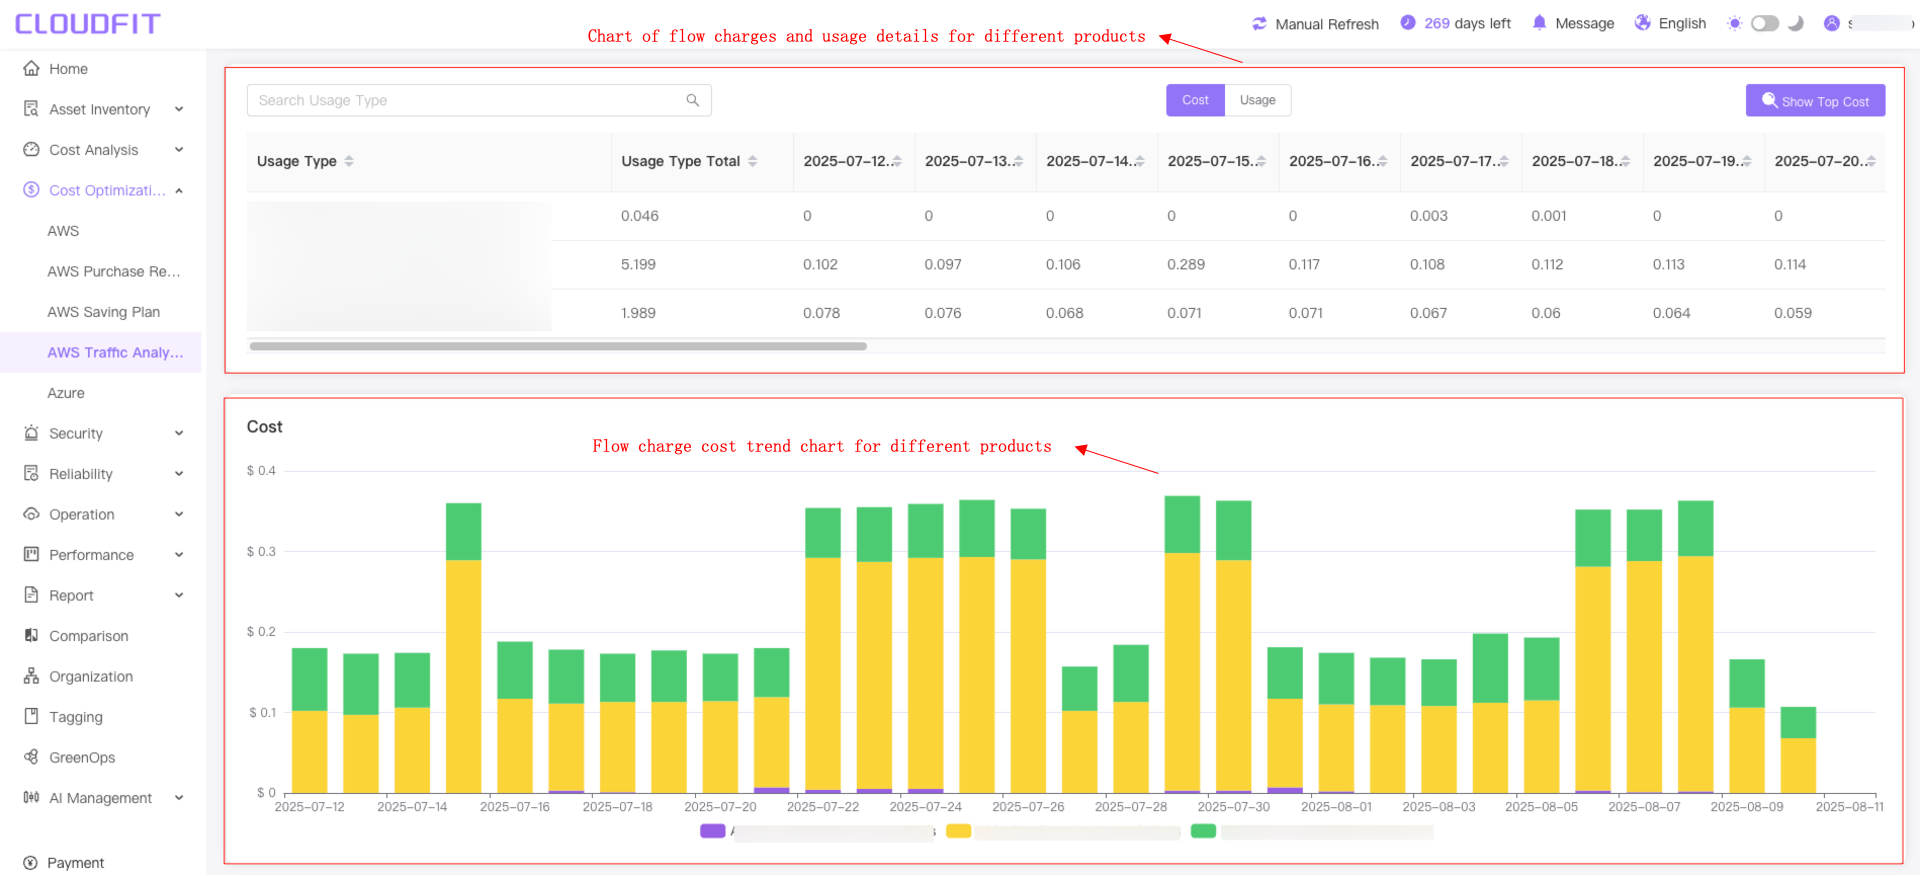
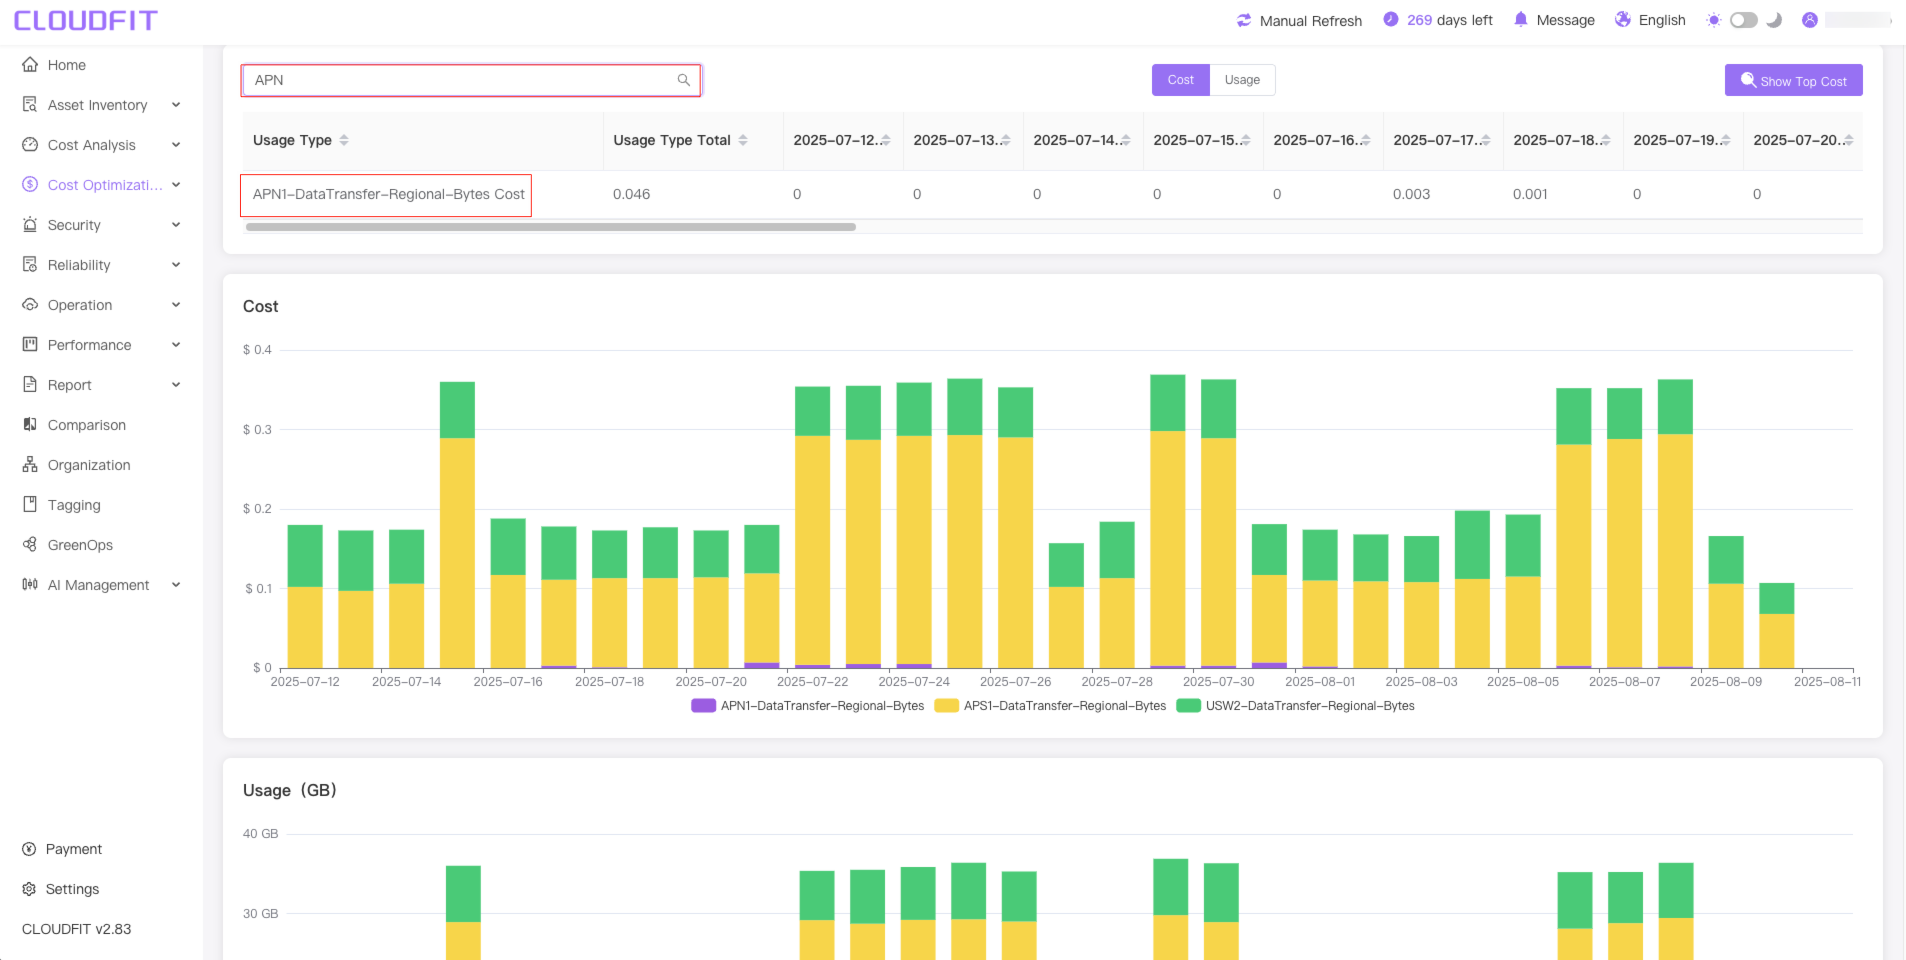
Lookup Usage type
Enter the type you are looking for in the search box to display the traffic usage details for that model,as shown below:
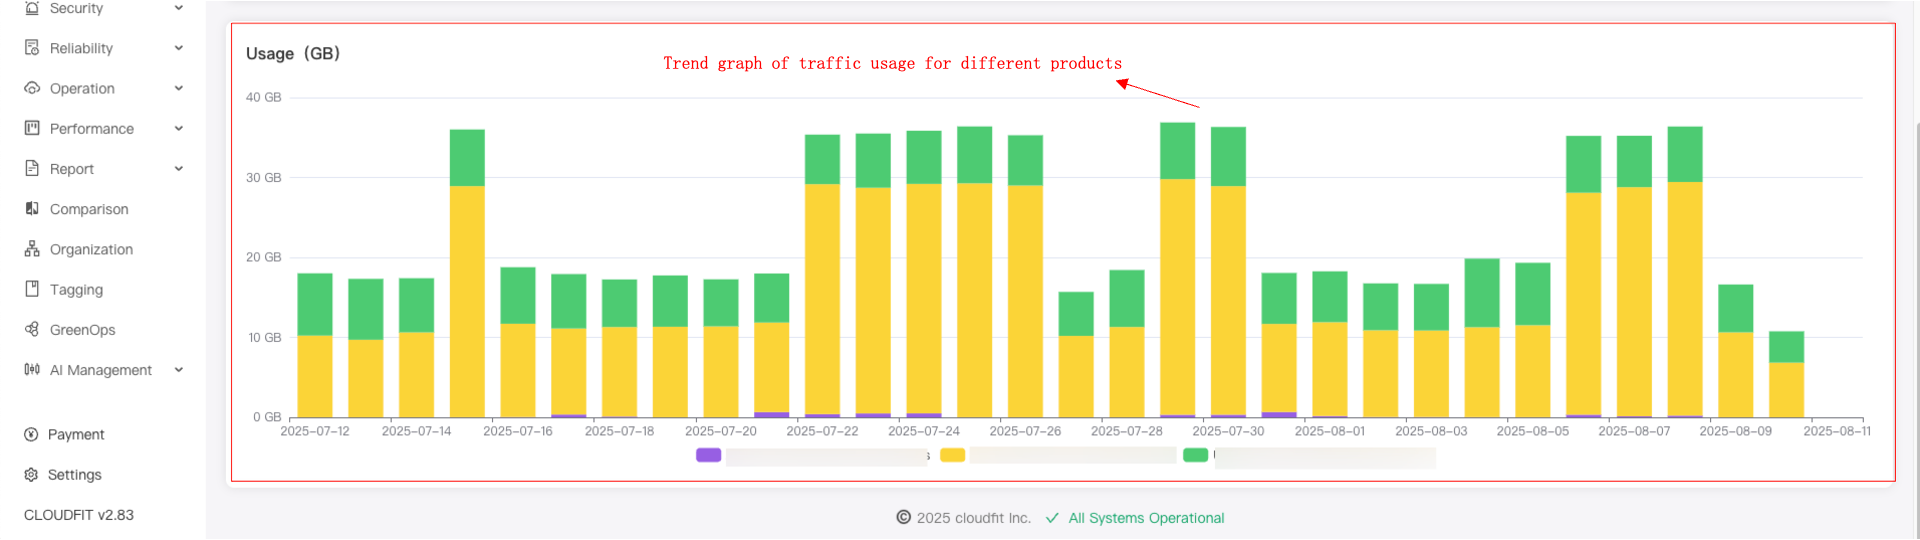
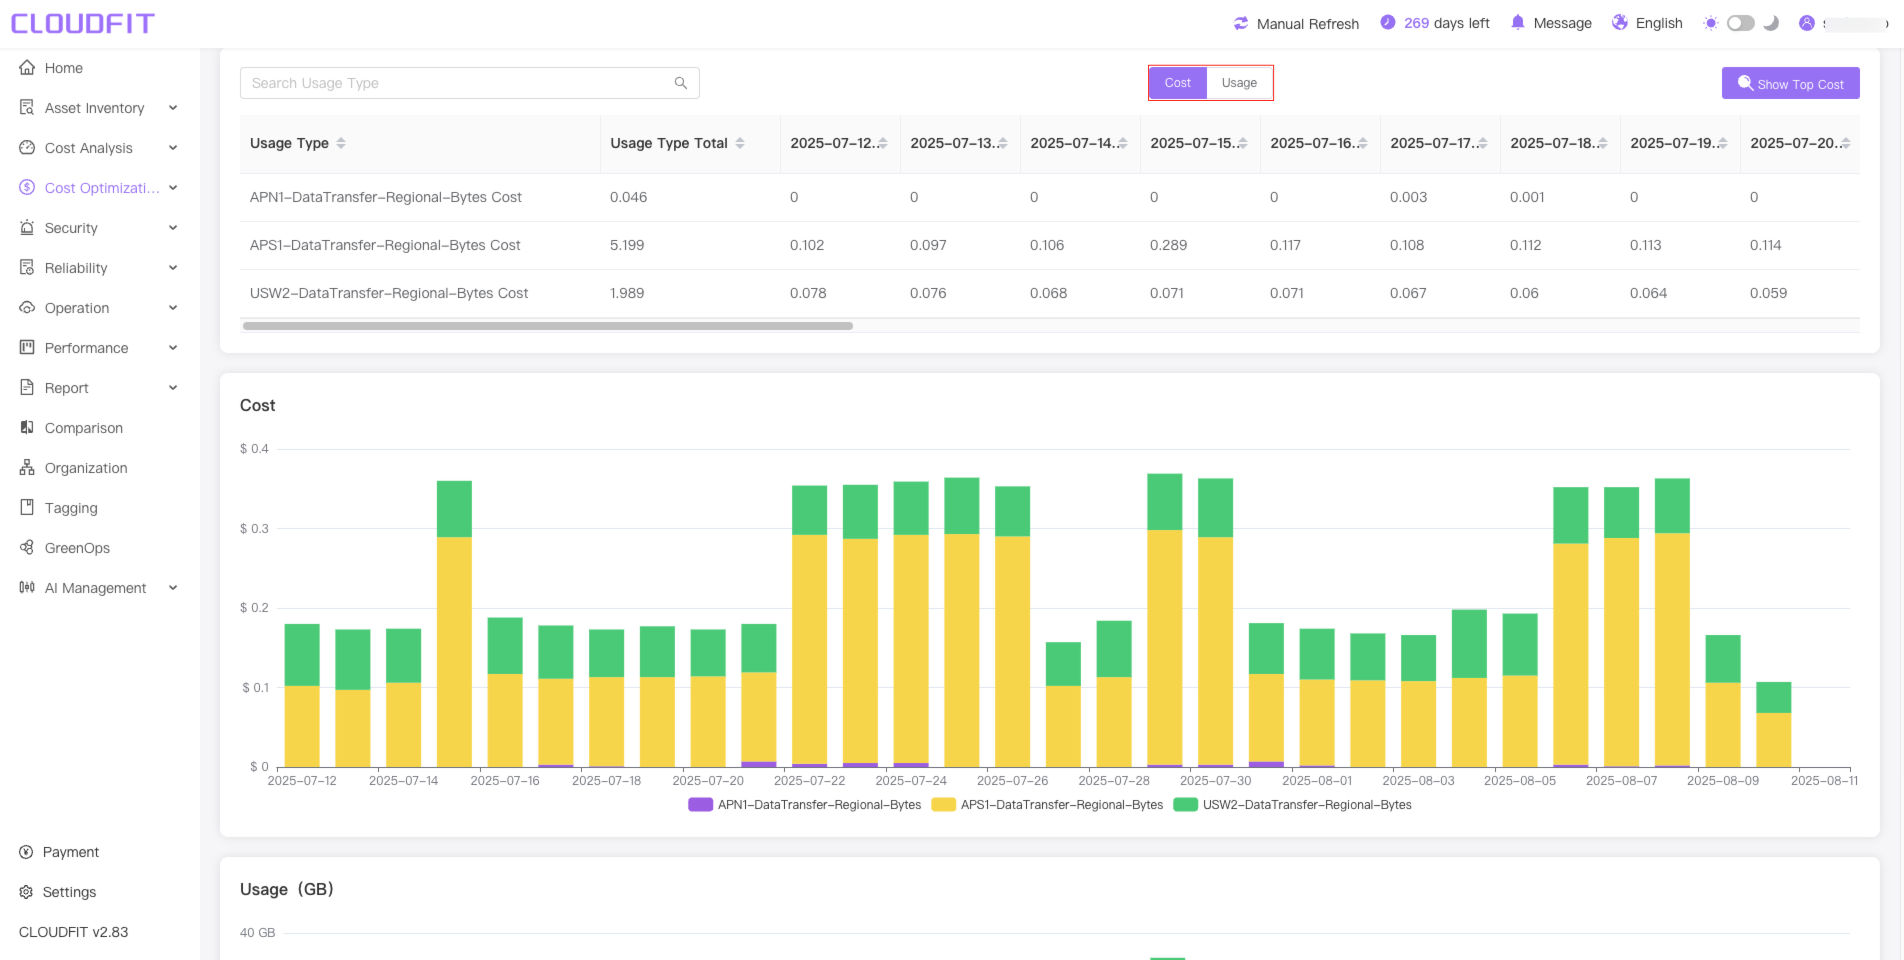
Cost and usage are displayed
Click Cost/Usage to toggle the cost or usage details,as shown below:
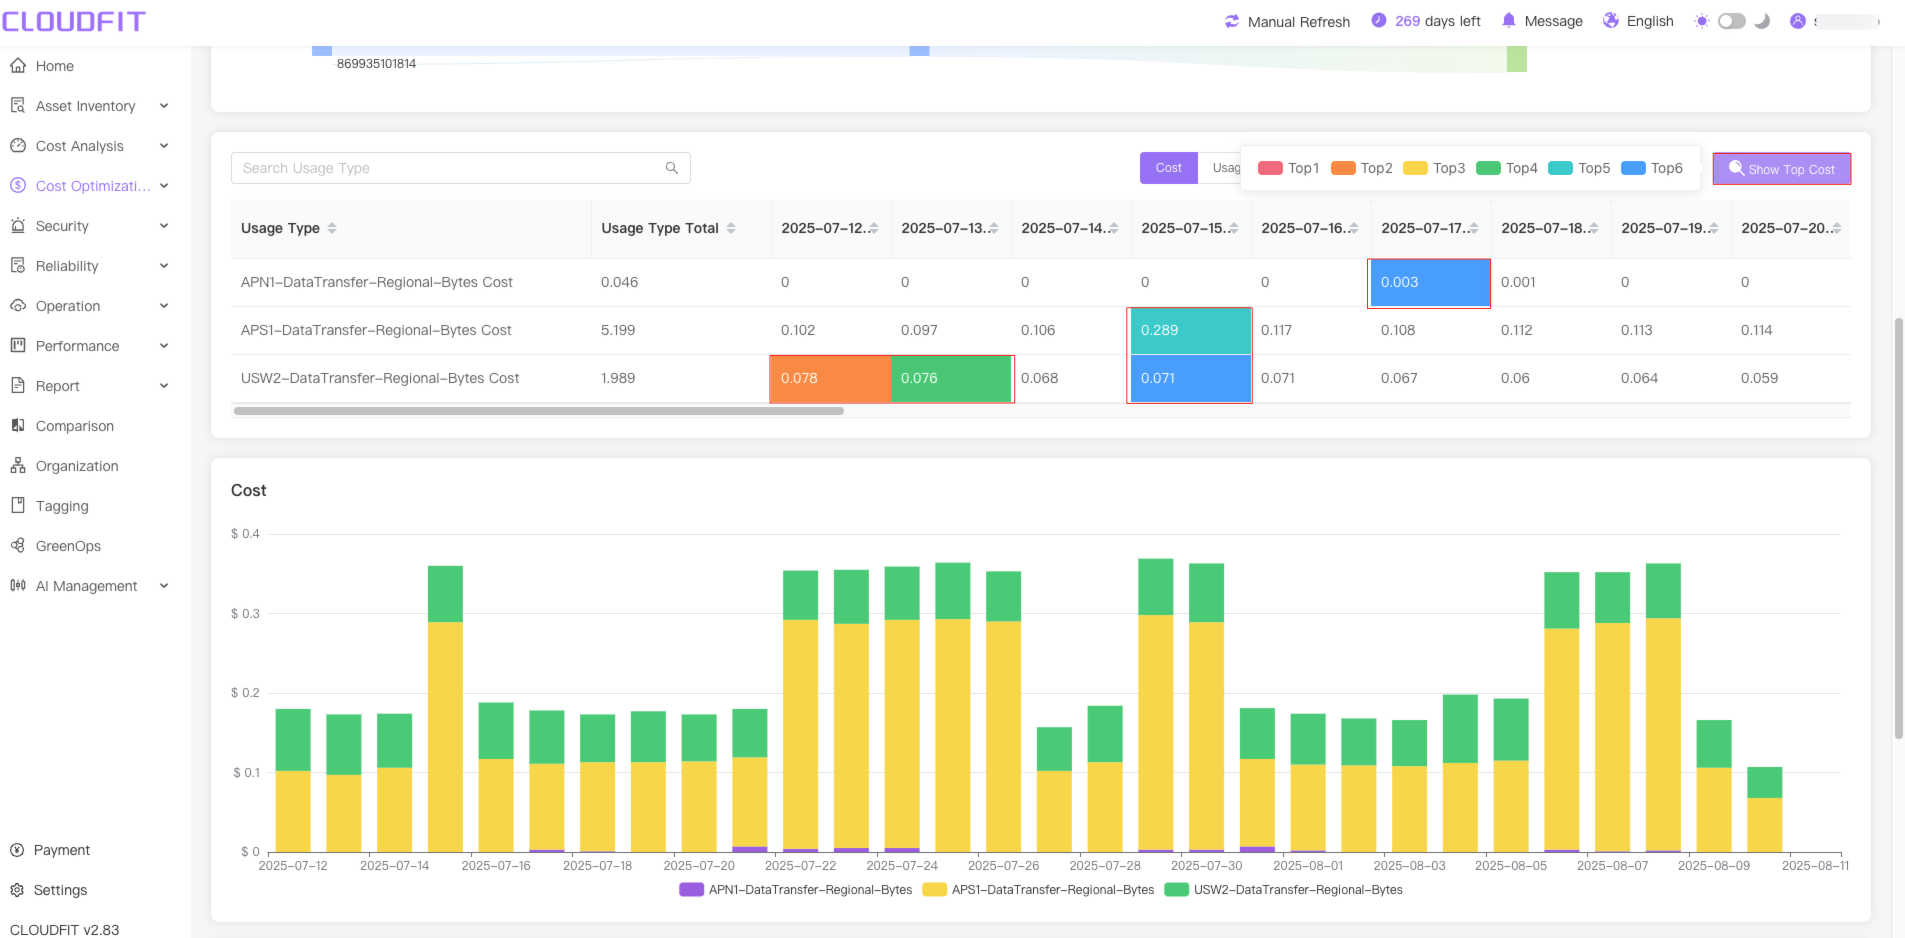
Cost display
Click the Show Top Cost button to display the top cost ranking,as shown below:
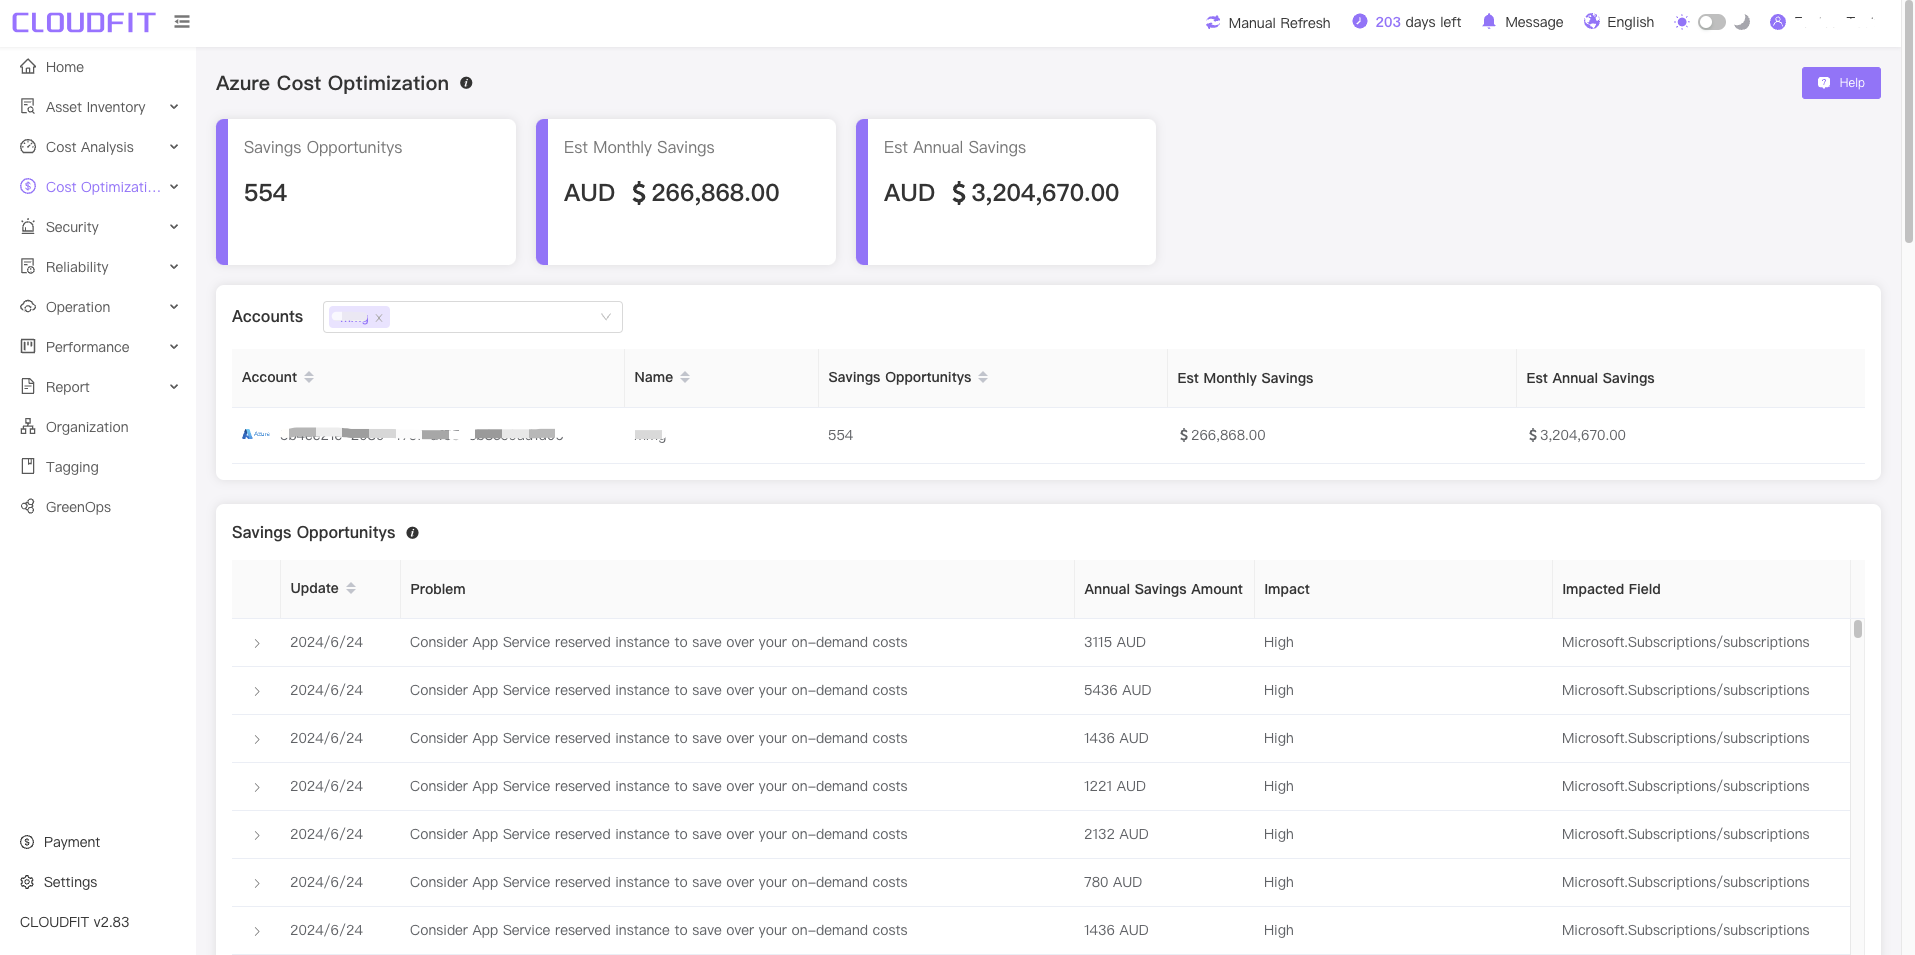
Azure
Tip`
Optimizing the assets of Azure cloud accounts aims to reduce costs while maintaining or improving efficiency.
Click on Cost Optimization -> Azure in the navigation bar to enter the page, as shown below: